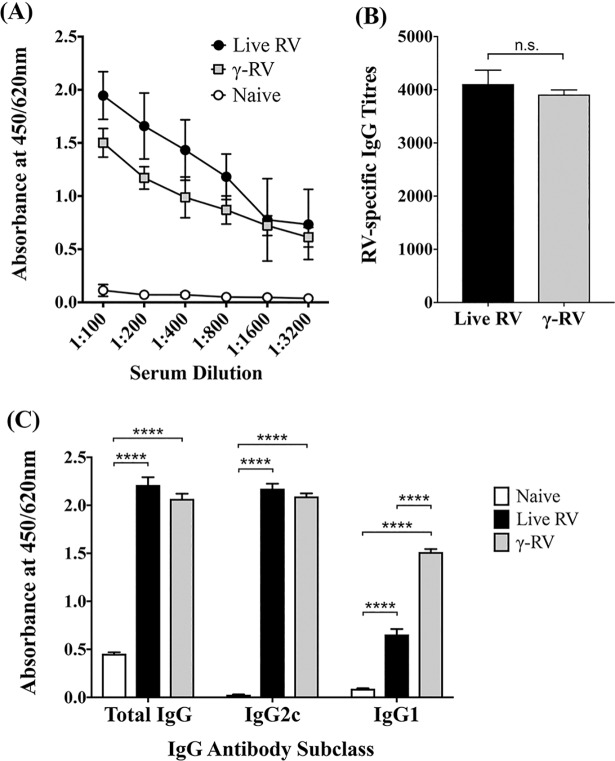
Fig 4. RV-specific antibody responses.
Mice were primed twice with live RV or γ-RV, 2 weeks apart. Serum samples harvested on Day 14 post-2nd priming and analysed for RV-specific IgG using ELISA. (A) Serial dilutions of serum samples and absorbance readings at 450/620 nm for total IgG. (B) IgG titres in primed groups calculated relative to cut-off value (dotted line), determined using OD values of serum from control mice. Data presented as mean ± SEM (n = 6), and analysed by unpaired t-test (n.s., not significant) (C) Absorbance at 450/620nm for total IgG, IgG1, and IgG2c in serum at 1:200 dilution by ELISA. Data presented as mean ± SEM (n = 4), analysed by One-Way ANOVA (****, p < 0.0001).

