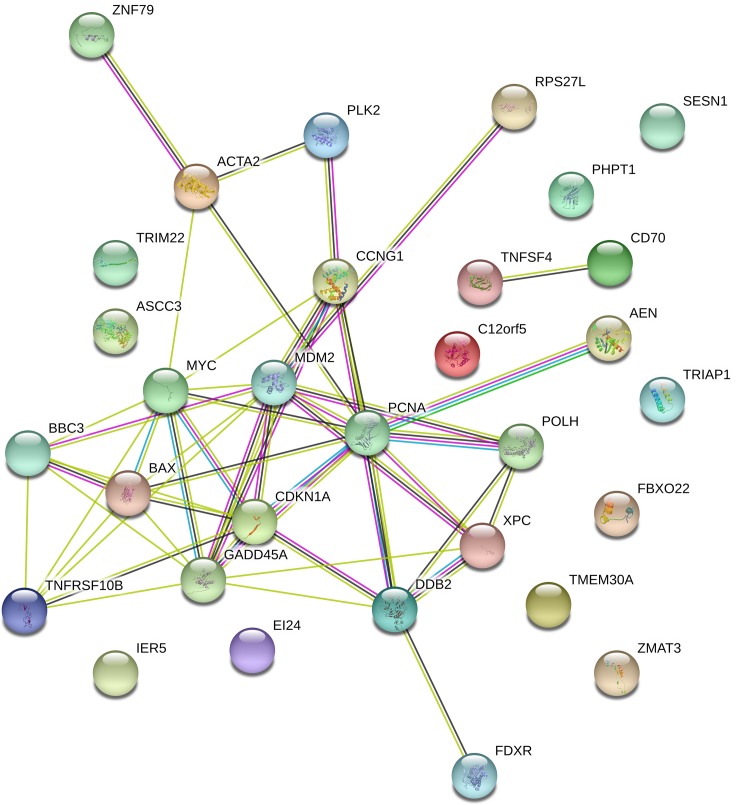
Fig 2. Protein-protein interaction enrichment network generated in STRING 10.5 using the 31 selected seed genes.
The edges represent protein-protein association. Blue and purple edges are known interactions (from curated databases and experimentally determined, respectively). Yellow and black edges are interactions derived from text-mining and co-expression respectively. The green edge between AEN and PCNA is a predicted interaction as gene neighborhood.

