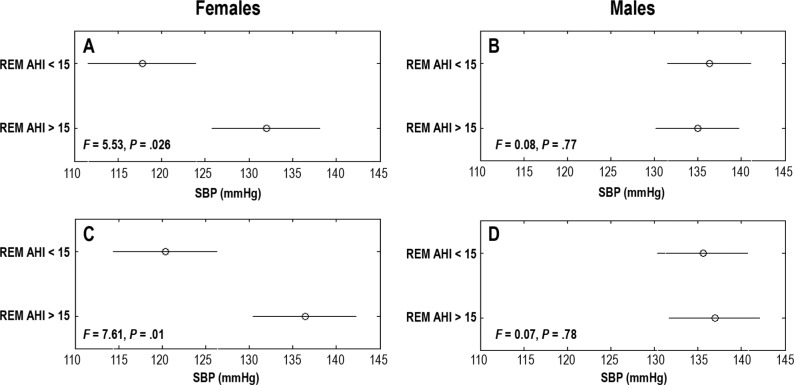
Figure 4. Comparison of SBP between females and males.
A comparison of SBP levels between females and males with REM AHI > 15 and < 15 events/h when REM AHI range was predicted by the models M5 (REM female) and M6 (REM male). SBP was measured in the morning after (A, B) and the evening before (C, D) the PSG study. Circles indicate the group means of one-way ANOVA tests and the horizontal lines indicate the comparison interval. F statistics represent the ratio of mean squared error of within group variation and between group variation of SBP. The P is the level of statistical significance of the difference between group means. If the differences are significant, then the horizontal lines are disjointed and P < .05. The lines overlap if the difference is insignificant and P > .05. AHI = apnea-hypopnea index, ANOVA = analysis of variance, PSG = polysomnography, REM = rapid eye movement, SBP = systolic blood pressure.

