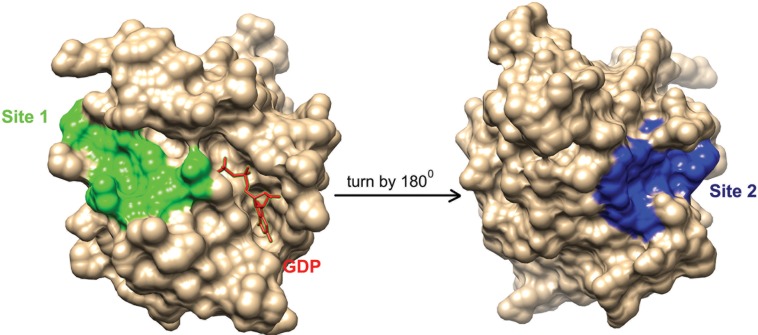
Fig 2. Site 1 and Site 2 in Rab11.
The figure shows site 1 (colored in green) and site 2 (colored in blue) in Rab11 representative structure 1OIV_A. Guanosine-5'-Diphosphate (GDP) in the active site near site 1 is shown as red sticks. The Rab11 structure is rotated by 1800 along the Y axis to show the location of site 2. The figures are generated using UCSF Chimera [65].

