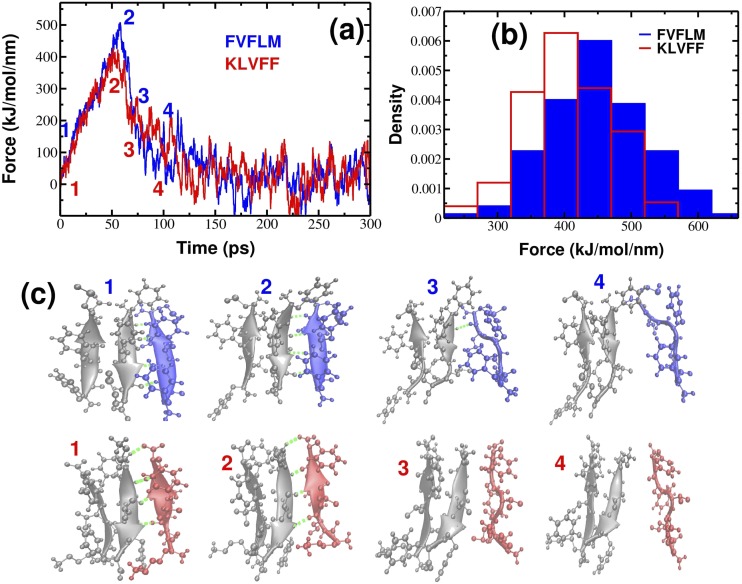
FIG. 3.
(a) Typical force-time profiles for FVFLM (blue) and KLVFF (red) peptides at v = 0.01 nm/ps. (b) Histograms of unbinding/rupture forces for FVFLM and KLVFF peptides. The histograms clearly show that the force peak moves toward higher values for FVFLM compared with KLVFF. (c) Details of the mechanical unfolding pathway of FVFLM are shown in blue (upper row) and of KLVFF are shown in red (bottom row). Hydrogen bonds between the pulled peptide and the template are indicated as dashed green lines.

