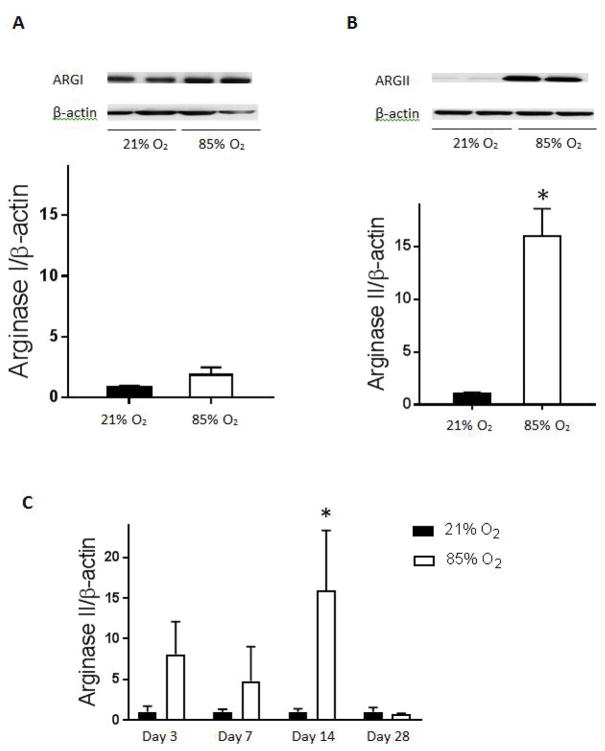
Figure 1. Arginase protein levels in C3H/HeN mouse lung homogenates.
Protein was isolated from C3H/HeN mouse lung homogenates and arginase I and II protein levels measured by western blot analysis. Representative western blot and densitometry levels for arginase I in hyperoxia (n=6) compared to normoxic control (n=8) (A). Arginase I protein levels are not significantly different after 14 days of hyperoxic exposure as compared to normoxic control. Representative western blot and protein levels for arginase II in hyperoxia (n=6) compared to normoxic control (n=8) (B). Arginase II protein levels are significantly greater after 14 days of hyperoxic exposure than normoxic controls (*p<0.05). Time course of arginase II protein expression after hyperoxic exposure as compared to normoxic control at days 3, 7, 14, and 28. Arginase II protein levels are again greater at 14 days of hyperoxia than normoxic controls (*p<0.05) (C). All arginase protein levels are normalized to β-actin. Normoxia is represented by black bars and hyperoxia is represented by white bars.

