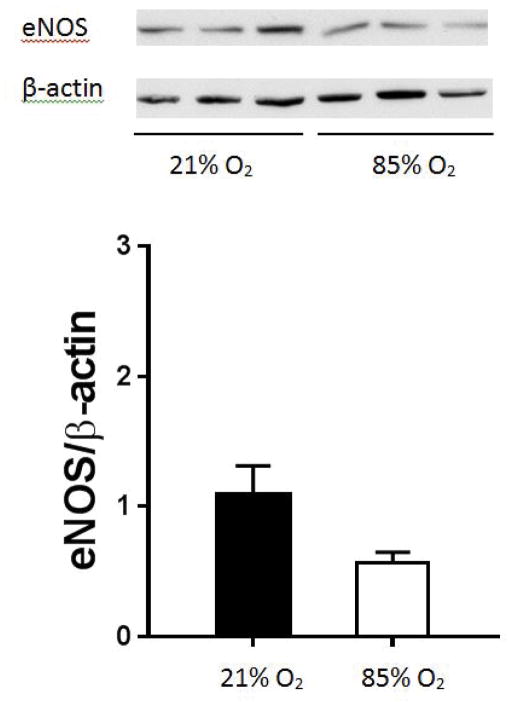
Figure 2. eNOS protein levels in C3H/HeN mouse lung homogenates.
Protein was isolated from C3H/HeN mouse lung homogenates and eNOS protein levels measured by western blot analysis. Representative western blot and densitometry levels for eNOS in hyperoxia (n=3) compared to normoxic control (n=3). eNOS protein levels are not significantly different after 14 days of hyperoxic exposure as compared to normoxic control. All eNOS protein levels are normalized to β-actin. Normoxia is represented by black bars and hyperoxia is represented by white bars.

