
Figure 3. Functional profiles and functional properties mapped to 171 SEED metabolic pathways comparing cohorts of asthma and control subjects.
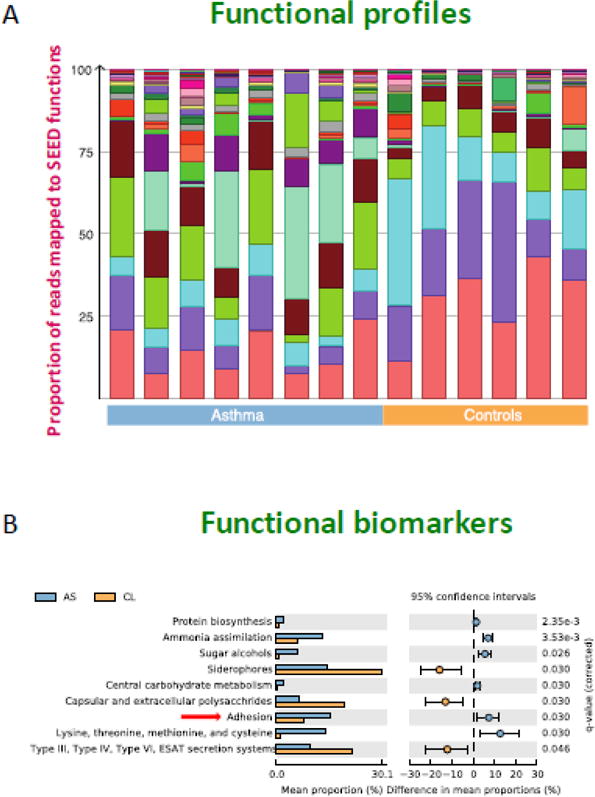
Panel A. Each color in the functional profile represents different SEED functions that were identified in the cohort, demonstrating the similarities and differences between asthmatics and healthy controls. Panel B. This extended error bar plot shows functional properties differing significantly between asthmatics (AS) and healthy controls (CL) with an effect size of one percent. Several pathways are significant, including one involved in virulence functions (adhesion).