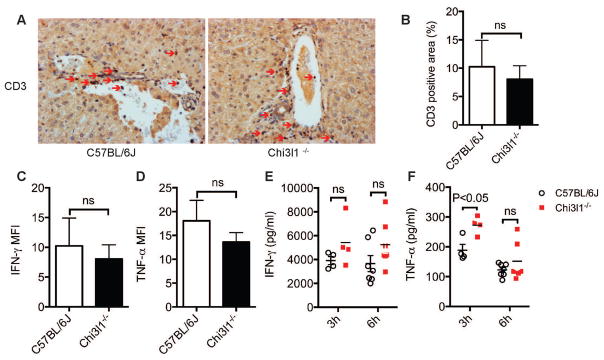
Fig. 2. Con A-induced T cell responses are not affected by Chi3l1.
Male WT and Chi3l1−/− mice were treated with Con A as described in Fig. 1. (A) At 6h after Con A administration, hepatic T cells were identified by immunohistochemical staining using anti-CD3 antibody (magnification: 200×). Red arrows indicate CD3+ T cells. Shown are representative images from at least 4 mice per group. (B) The number of hepatic CD3+ T cells are quantified by Image J. (C–D) At 3h after Con A administration, CD3+ T cell-derived IFN-γ (C) and TNF-α (D) were measured by intracellular staining and flow cytometry (n=5 mice per group). (E–F) At 3h and 6h after Con A administration, Serum levels of IFN-γ (E) and TNF-α (F) were measured by ELISA (n=4–7 mice per group). P values are as indicated. Two-tailed, unpaired t test were performed in B–F.

