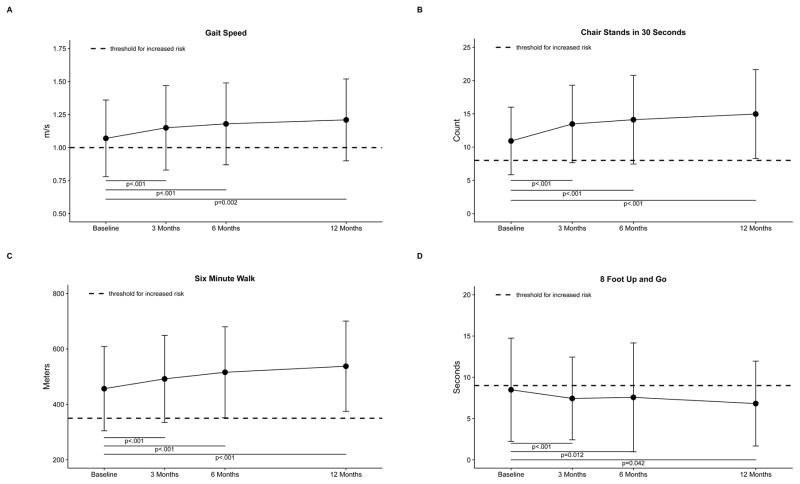
Figure 1.
Change from baseline at 3, 6, and 12 months in (A) usual gait speed, (B) number of chair stands completed in 30 seconds, (C) 6-minute walk distance, and (D) 8-foot up and go test. The dotted line indicates a threshold for high risk of loss of independence for the sex and mean age of the study sample. Above the line indicates better function except for the 8-foot up and go test. Models were limited to participants with baseline and at least one follow-up and included control for the baseline value of variable of interest. Sample sizes were n=366 at baseline and n=294, n=213, and n=128 for each successive time point. Some sites did not have time to accrue participants for the 12-month follow-up. P-values are shown for change from baseline.

