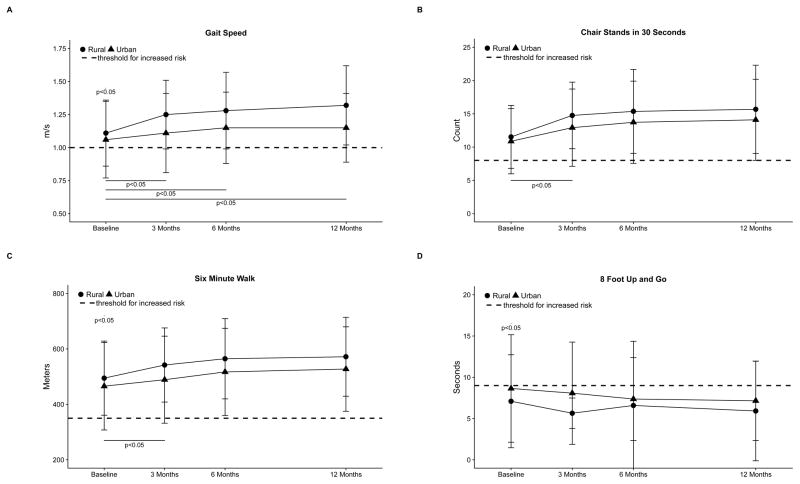
Figure 3.
Differences between baseline and change from baseline at 3, 6, and 12 months between program participants living in urban and rural sites for (A) usual gait speed, (B) number of chair stands completed in 30 seconds, (C) 6-minute walk distance, and (D) 8-foot up and go test. The dotted line indicates a threshold for high risk of loss of independence for the sex and mean age of the study sample. Above the line indicates better function except for the 8 foot up and go test. Models were limited to participants with baseline and at least one follow-up and included control for the baseline value of variable of interest. Samples sizes were n=348 at baseline and n=283, n=218, and n=150 for each successive timepoint for participants in urban settings and n=151 at baseline n=138, n=102, and n=62 for each successive timepoint for participants in rural settings. Some sites did not have time to accrue participants for 12-month follow-up. P-values are shown for the differences between urban and rural sites.

