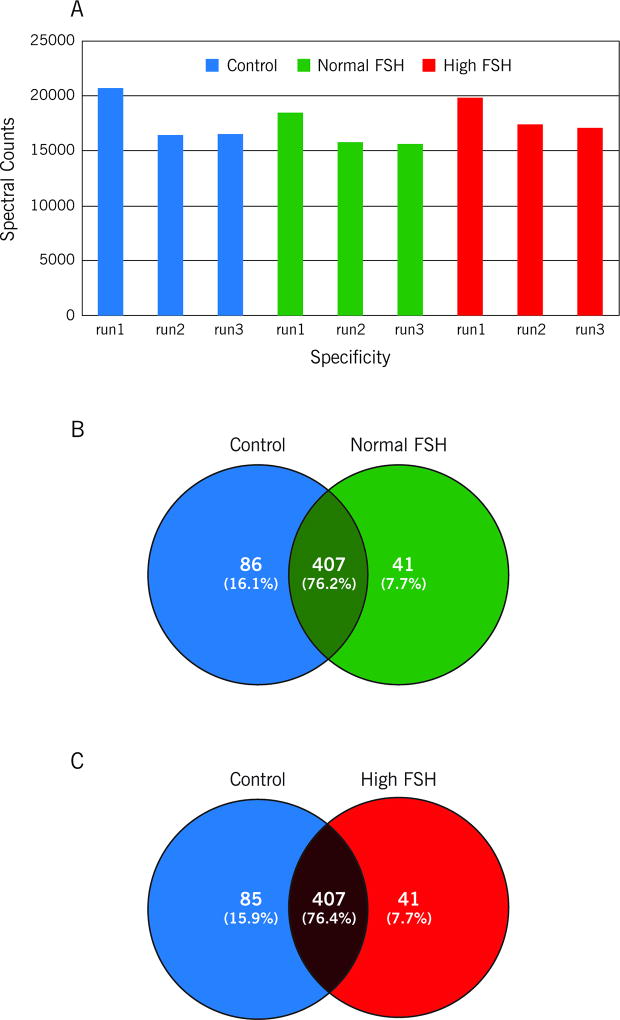
Figure 1.
The relative quantity of the seminal plasma proteins was determined by comparing the number of spectral counts, used to identify each protein in A: control, normal FSH and high FSH group. The total spectral counts ranged from 15698 to 20715, B: Venn diagram showing the overlap between the proteins identified in the control and normal FSH groups, C: Venn diagram showing the overlap between the proteins identified in the control and high FSH groups.

