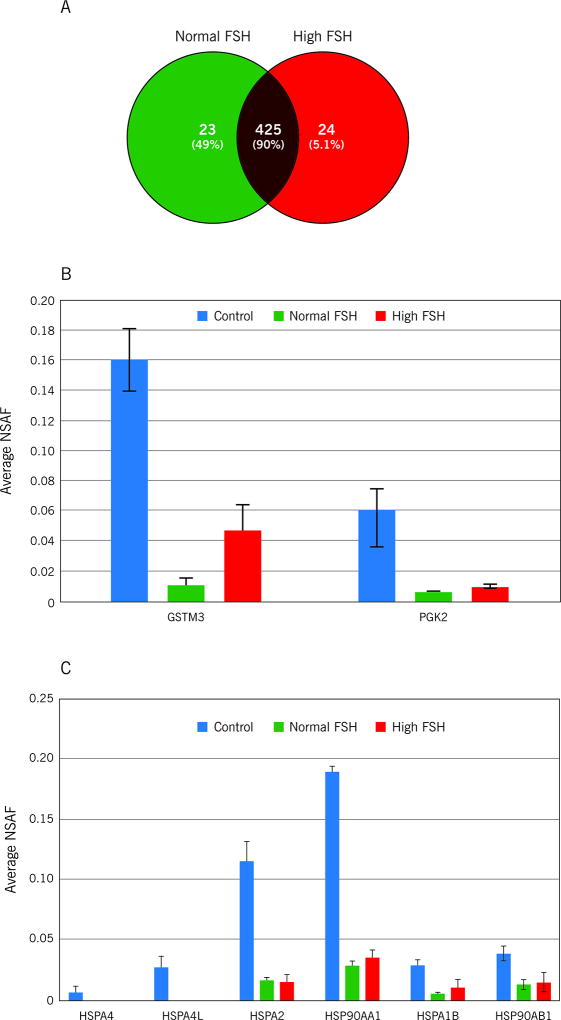
Figure 3.
Venn diagram showing the overlap between the proteins identified in the A: normal FSH and high FSH groups, B: Average NSAF of GSTM3 and PGK2. Bar represents average ± standard deviation calculated for three MS runs, C: Average NSAF of heat-shock proteins (HSP90AB1, HSPA1B, HSP90AA1 and HSPA2, HSPA4L and HSPA4). Bar represents average ± standard deviation calculated for three MS runs.

