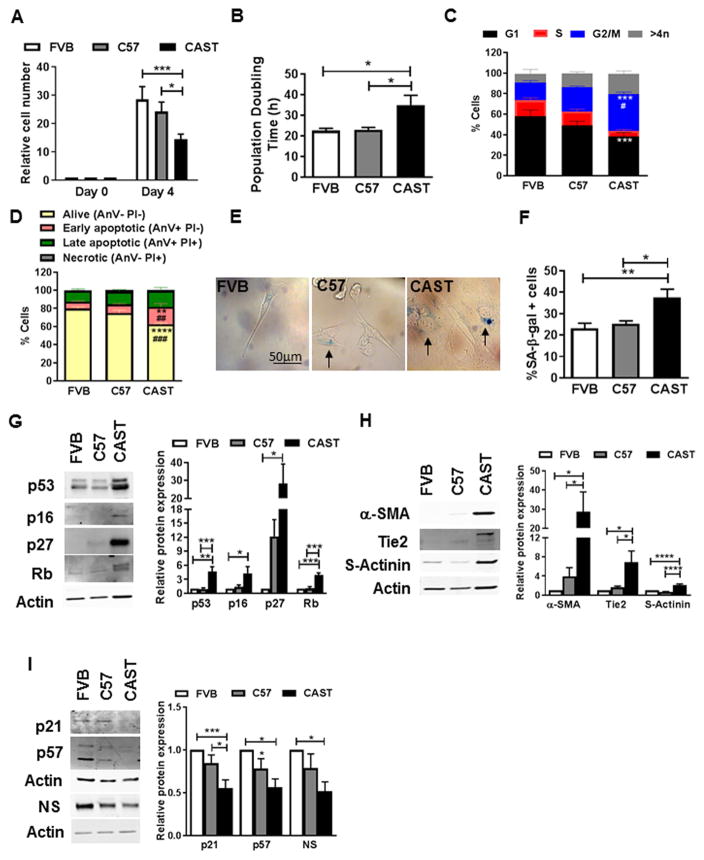
Figure 2. CAST CPCs exhibit altered cell fate.
A. Cell number normalized to day 0 and assessed by microscopic counting of live cells (N=9). B. Population doubling time calculated from live cell counts (N=12). C. Cell cycle stage assessed by measuring DNA content using flow cytometry (N=4). D. Flow cytometry based cell death analyses as assessed by propidium iodide (PI) and AnnexinV (Anv) staining of live cells (N=4). E–F. Phase contrast micrographs (E) and counts (F) of CPCs stained with senescence associated β-galactosidase (SA-β-gal). Arrows indicate senescent, blue cells (N=7). G–I. Immunoblots and densitometric analyses of senescence markers p53, p16, p27 and Rb (G), cardiomyogenic lineage commitment markers α-smooth muscle actin (α-SMA), Tie2 and sarcomeric actinin (s-actinin) (H), and quiescence/stemness markers p21, p57 and nucleostemin (NS) (I) (N=4–15). *p<0.05, **p<0.01, ***p<0.001, ****p<0.0001, * and # indicate comparison to FVB and C57 respectively and number of # represents p value similar to * (C,D). Two-way Anova (A,C,D), One-way Anova (B,F–I).

