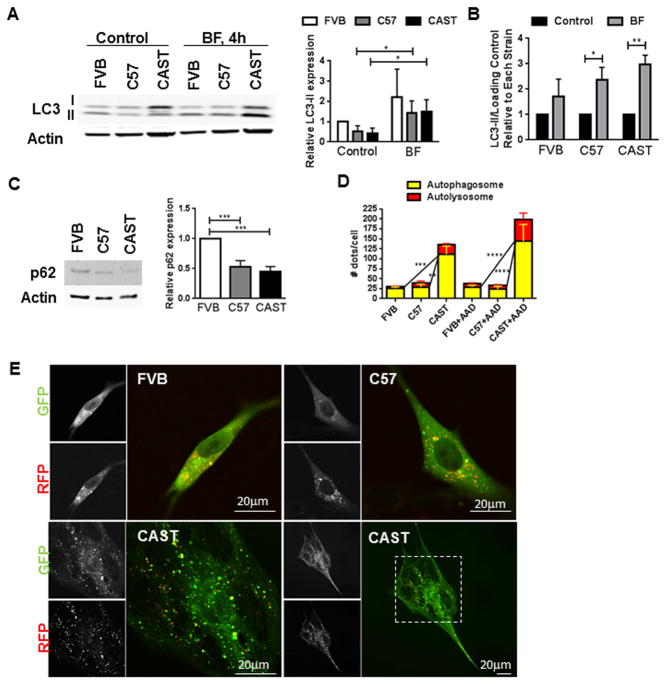
Figure 4. Activation of autophagy in CAST CPCs.
A–B. Immunoblots and densitometric analyses of LC3-II expression in CPCs cultured under control conditions or treated with autophagy inhibitor bafilomycin (BF, 100nM, 4hours). LC3-II is normalized to Actin expression and expressed relative to FVB control CPCs (A) or control of each strain (B) (N=3–4). C. Expression of p62 as determined by immunoblots and densitometric analyses (N=8). D–E. CPCs were transduced with Premo Autophagy sensor, a baculovirus expressing RFP-GFP-LC3. Counts of autophagosomes and autolysosomes/cell under basal conditions and following amino acid deprivation (AAD), achieved by 1 hour treatment with Hanks balanced salt solution (D). Yellow dots in overlaid images indicate autophagosomes and red dots that do not overlay with green puncta indicate autolysosomes. Representative micrographs of autophagy puncta are shown (E) (N=4–5). *p<0.05, **p<0.01, ***p<0.001. Multiple t-tests (A–B), One-way Anova (C), Two-way Anova (D).

