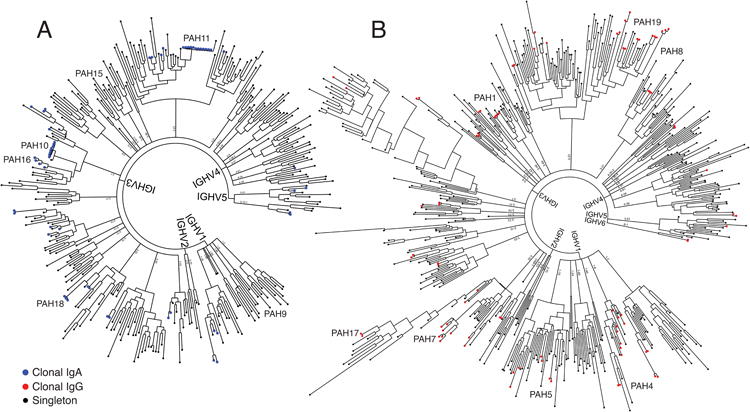
Figure 2. Representative phylogenetic trees of plasmablast antibody repertoires in IPAH.

The paired HC and LC variable regions of individual plasmablasts isolated by flow cytometry were sequenced from four individuals with IPAH, and a representative phylogenetic tree from one subject is presented (see Supplemental Figure S1 for phylogenetic trees from the other subjects). The paired, consensus HC and LC antibody sequences from each plasmablast were binned and ordered by HC V-gene usage and clustered to create phylogenetic trees. Antibodies from clonally expanded lineages are represented by colored tips, with blue representing clonal lineage members expressing the IgA isotype (A) and red representing clonal lineage members expressing the IgG isotype (B). Tips representing non-clonal (singleton) sequences of either isotype are colored black. Representative sequences expressed as recombinant mAbs are labeled with text on each tree. The presented trees include antibodies derived from n=340 IgA expressing and n=519 IgG expressing plasmablasts.
