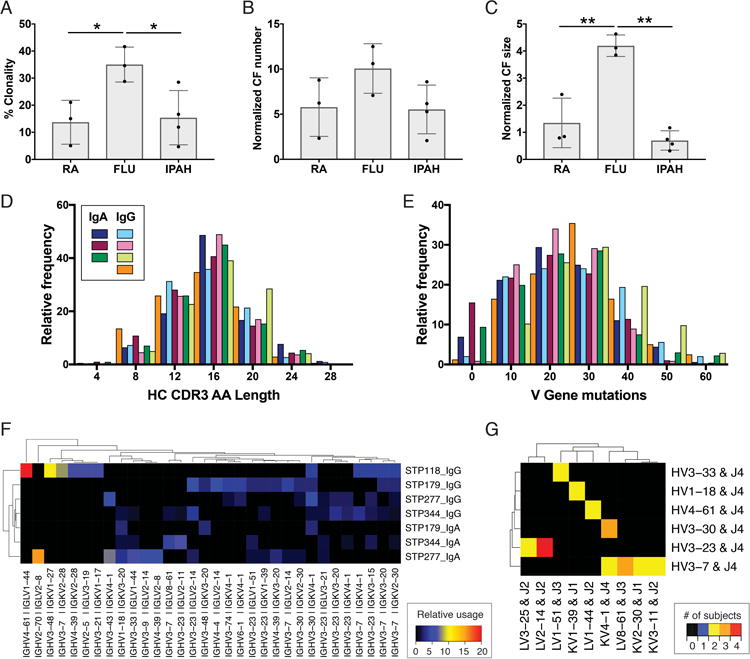
Figure 3. Cellular and molecular characteristics of IPAH plasmablast antibody repertoires.

Paired HC and LC antibody sequences from individual plasmablasts underwent bioinformatic analyses of the clonal relationships and predicted germline gene segment usage of each cell. (A-C) Comparison of IPAH repertoire clonality with previously published rheumatoid arthritis (RA, GenBank Accession Numbers KJ423107-KJ424184) and Influenza vaccine (FLU, GenBank Accession Numbers KF994033-KF994563) repertoires. Each bar represents the mean ± SD of all subjects in a group, and each dot represents the value derived from an individual subject. (D) HC CDR3 amino acid length for the IgG and IgA IPAH repertoires. Each colored bar represents an individual patient's IgA or IgG plamablast repertoire. (E) HC V gene mutations from the predicted germline sequence. (F) Heatmap visualization of the most frequent HC and LC V gene usage combinations for each patient. Relative usage is defined as the frequency of a given gene combination normalized relative to sequencing depth. Gene combinations with 3% or greater usage in at least one repertoire are included on the plot. (G) Heatmap visualization of V and J gene usage across subjects. Color indicates the number of subjects who used a given HC V-J plus LC V-J gene combination at least two times. Genes with a combination used by at least two subjects are included on the plot. ** P<0.01, *P<0.05 by one-way ANOVA with Tukey's post-hoc test. For (A-G) n = 4 (IPAH); for (A-C) n = 3 (FLU), 3 (RA).
