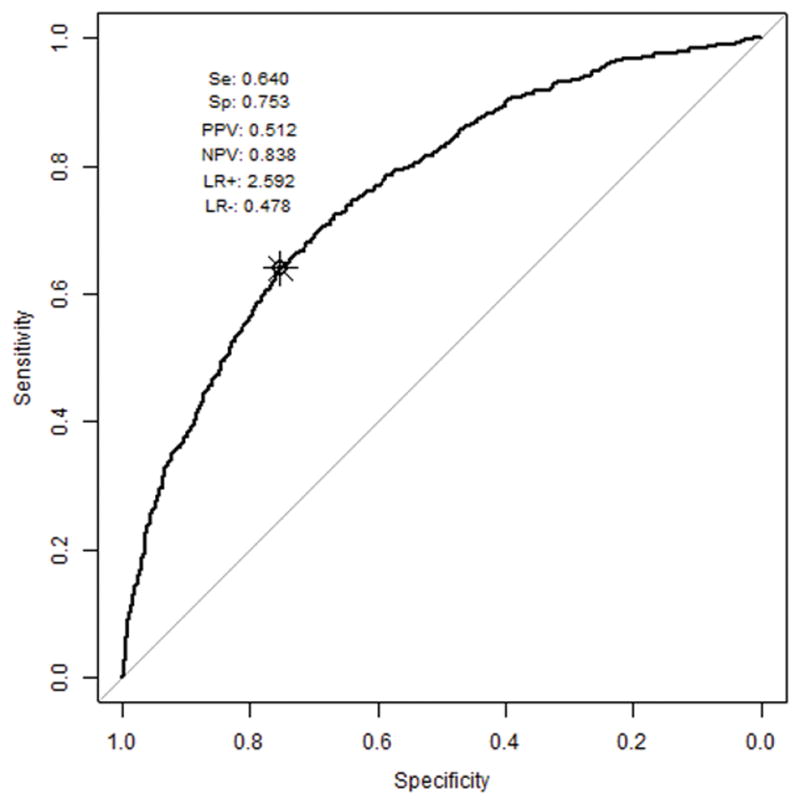
Figure 1.

Receiver operating characteristic curve for final model
The receiver operating characteristic curve with labeled Youden’s Index (best trade-off of sensitivity and specificity), including corresponding values for: Se (sensitivity), Sp (specificity), PPV (positive predictive value), NPV (negative predictive value), LR+ (positive likelihood ratio), LR− (negative likelihood ratio). This figure also displays the distribution of events in a histogram at top.
