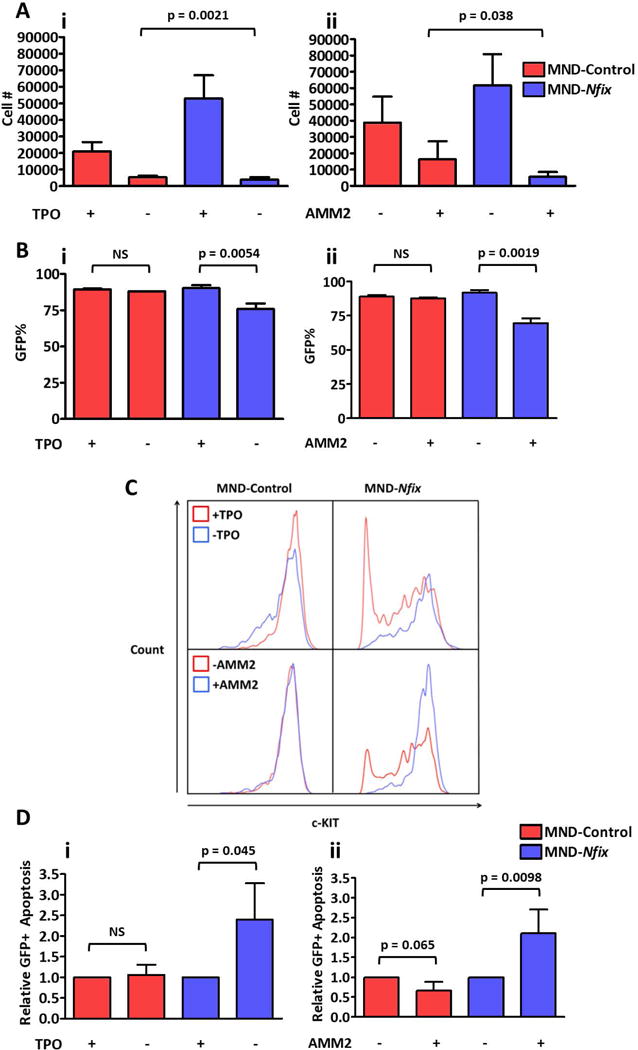
Figure 4. The anti-apoptotic effect of Nfix in HSPC depends on c-MPL signaling.

(A) Relative number of cells in control and NFIX+ cultures (i) with or without TPO and (ii) with or without AMM2 72 hours after replating (TPO, n = 3; AMM2, n = 6). Bar indicates significant difference in the extent of cell loss after 72 hours of culture between control and NFIX+ cells. (B) Percentage of GFP+ cells in control and NFIX+ cultures (i) with or without TPO and (ii) with or without AMM2 72 hours after replating (TPO, n = 3; AMM2, n = 6). (C) Representative fluorescence histograms of GFP+ control and NFIX+ cultures to illustrate shift in c-KIT intensity 72 hours after removal of mTPO or addition of AMM2 (TPO, n = 3; AMM2, n = 6). (D) Relative levels of apoptosis in GFP+ compartment of control and NFIX+ cultures (i) with or without TPO and (ii) with or without AMM2 72 hours after replating (TPO, n = 3; AMM2, n = 6). All values represent mean ± standard deviation. NS denotes not significant.
