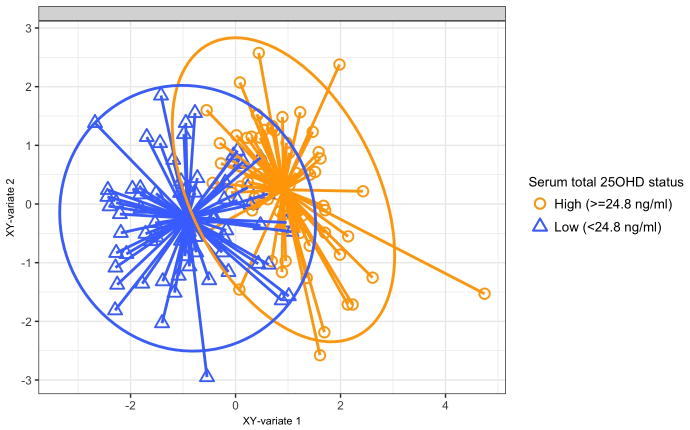
Figure 1. Sparse partial least squares analysis score plot of serum metabolome according to total 25-hydroxyvitamin D levels.
Each dot represents the global serum metabolomic profile of a single infant, by plotting the component scores in the smaller subspace spanned by latent variables of sparse partial least squares (sPLS) model. The scatter plot indicates the similarities and dissimilarities in the global metabolome profile between infants, grouped by serum total 25OHD status (defined by the median values). The eclipses are 95% confidence intervals. The arrows start from the centroid of each group and end for each patient belonging to each group.

