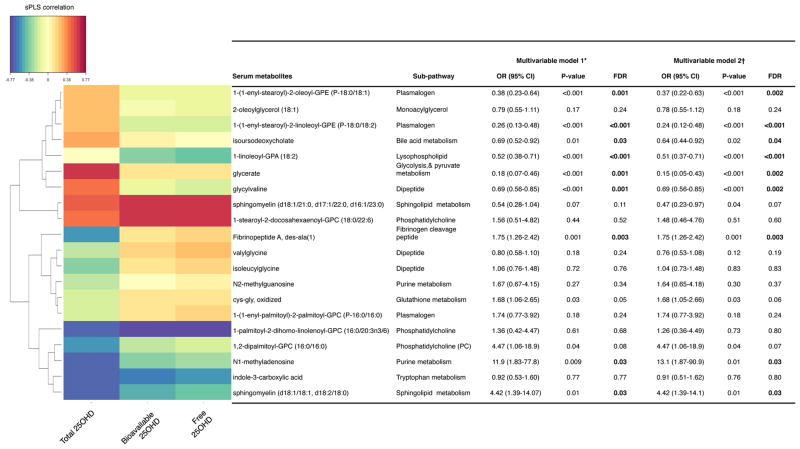
Figure 2. Correlations between serum 25-hydroxyvitamin D (25OHD) and selected serum metabolites, and their associations with the risk of positive pressure ventilation use among infants hospitalized with bronchiolitis.
The heatmap (left) visualizes the correlations between the serum 25OHD (total, bioavailable, and free) levels and 20 selected metabolites that were examined using hierarchical clustering with an average linkage algorithm. The table (right) shows the adjusted associations between each of selected serum metabolites with the risk of PPV use. Bold results are statistically significant with FDR of <0.05. OR are calculated per each incremental increase in scaled level.
Abbreviations: 25OHD, 25-hydroxyvitamin D; CI, confidence interval; FDR, false discovery rate; GPA, glycerophosphate; GPC, glycerophosphocholine; GPE, glycerophosphorylethanolamine; OR, odds ratio; sPLS, partial least squares.
* Logistic regression models adjusting for patients’ age, sex, history of premature birth, feeding status, weight at presentation, corticosteroid use, and detected virus.
† Random-effects models adjusting for the covariates above and accounting for potential patient clustering within the hospitals.

