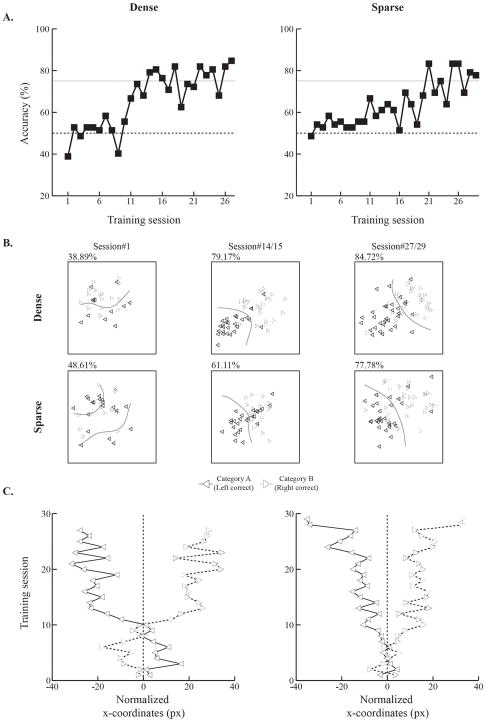
Figure 2. Visual categorization learning in individual rats from the dense and sparse groups.
A. Accuracy increased in rats from both category-feature density groups as training proceeded. Rats with similar numbers of training sessions to reach criterion were selected for comparison in this figure. Accuracy deviated from the chance level (dotted lines) after 1 or 2 weeks of training for rats in both groups. Later, however, rats in the dense group reached the learning criterion (solid lines) earlier than the sparse rats B. Touch patterns on the cue category stimuli across training. Rats were trained to touch the cue category stimuli 3 times to move on to the next phases in the trial sequence. The trial-averaged coordinates of touch patterns were plotted by category condition (left-arrow for Category A and right-arrow for Category B) across the very first, middle, and last sessions. Touch patterns were also used to train an SVM classifier across training. Solid curved lines represent hyperplanes generated by the SVM classifier. The numbers on top of each pattern denote accuracy during the specified training sessions. Touches for Category A became more separable from Category B as learning proceeded in both rats. The hyperplanes enhanced the clarity of these separations. C. Touch coordinates for Categories A and B diverged across training. The visual patterns from B were quantified and plotted across the training sessions. During initial learning, touches were occasionally mapped in opposite directions or gathered around the chance level (vertical dotted lines). As rats learned the task, however, the x-coordinates from each category progressively diverged.

