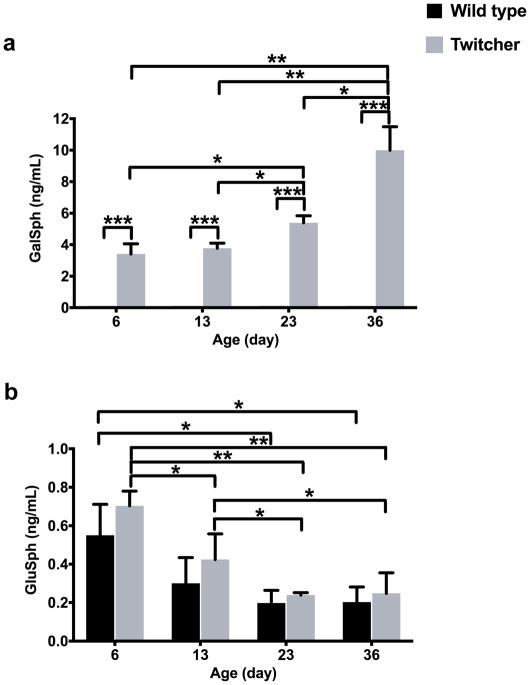
Figure 4.
GalSph (a) and GluSph (b) in serum samples obtained from wide type (n = 3) and twitcher (n = 3) mice at different ages, expressed as mean values ± SD. The GalSph levels in all the wild type samples are below LLOQ and assigned as half LLOQ (0.1 ng/mL) for purposes of plotting and statistical analysis. *: p < 0.05; **: p < 0.01; ***: p < 0.0001.

