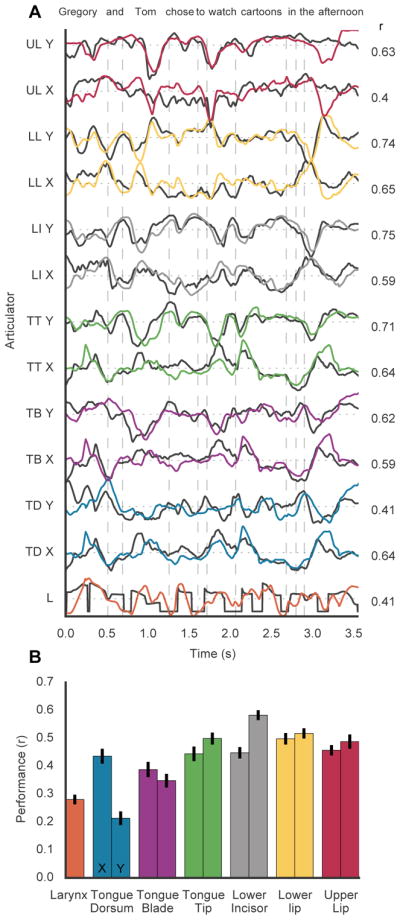
Figure 8. Decoded articulator movements from vSMC activity.

A, Original (black) and predicted (colored) X and Y coordinates of articulation movements during the production of an example held-out sentence. Pearson’s correlation coefficient (r) for each articulator trace. B, Average performance (correlation) for each articulator for 100 sentences held out from training set.
