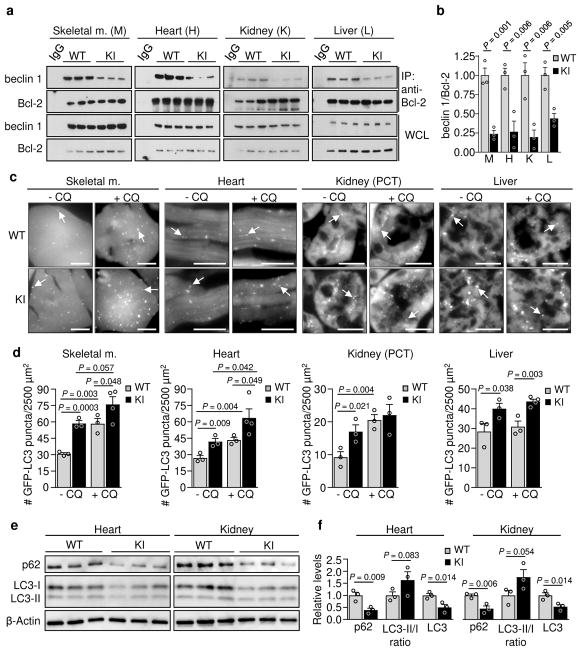
Figure 1. Effects of beclin 1 F121A mutation on beclin 1/Bcl-2 interaction and basal autophagy.
a, Co-immunoprecipitation of beclin 1 and Bcl-2 in indicated tissues from two month-old Becn1WT/WT (WT) and Becn1F121A/F121A (KI) animals. b, Quantitation of beclin 1 co-immunoprecipitated with Bcl-2 in (a). c, Representative images of GFP-LC3 puncta (autophagosomes) in indicated tissues from Becn1WT/WT:GFP-LC3 (WT) and Becn1F121A/F121A:GFP-LC3 (KI) mice +/− chloroquine (CQ) (50 mg kg−1, 6 h). Scale bars, 10 μm. (See enlarged images, Extended Data 1). White arrows denote representative GFP-LC3 puncta. d, Quantitation of GFP-LC3 puncta +/− CQ in indicated tissues. e, Western blot analysis of autophagy markers in hearts and kidneys of 2 month-old WT and KI mice. f, Quantitation of p62 and total LC3 levels (normalized to β-Actin) and LC3-II/I ratio in (e). Bars represent mean ± s.e.m for three mice per genotype. For (a) and (e), each lane represents a different mouse. One-sided unpaired t-test. PCT, renal proximal convoluted tubules. WCL, whole cell lysate. For uncropped gels, see Supplementary Fig. 1.

