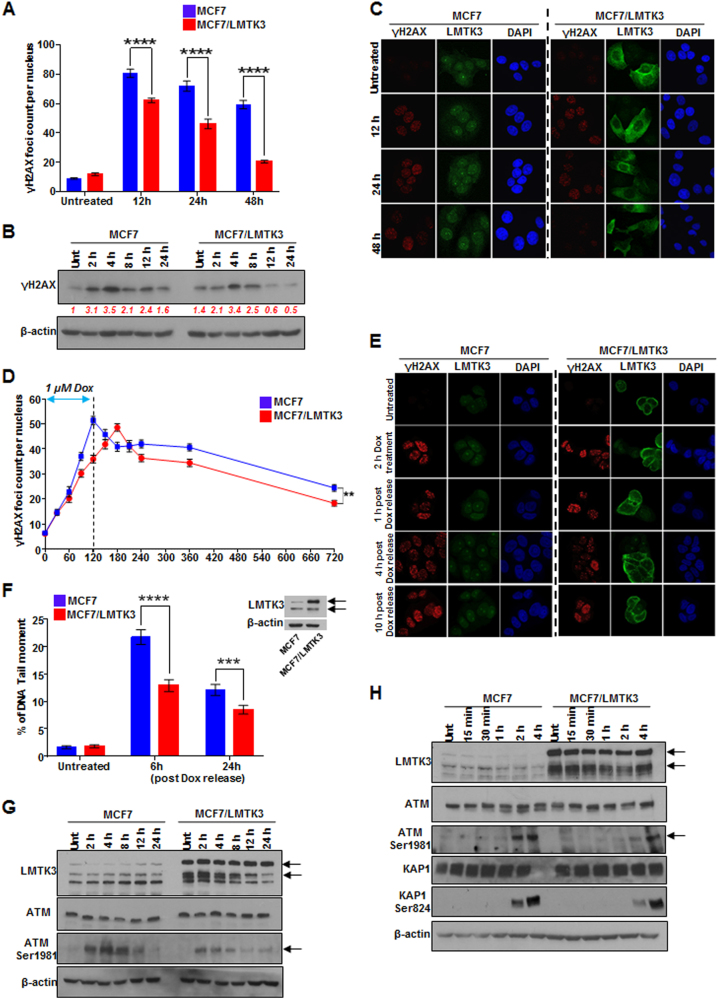
Fig. 2.
Overexpression of LMTK3 delays doxorubicin-induced DNA DSBs and affects the phosphorylation of ATM. a MCF7 and MCF7/LMTK3 cells were treated with 0.4 µM of doxorubicin and 12, 24, and 48 h later, quantitative analysis of γH2AX foci was performed. All error bars represent the mean ± SEM (50 cells were analyzed per each time point; ****P ≤ 0.0001). b Western blot analysis for endogenous γH2AX levels in MCF7 and MCF7/LMTK3 cells following doxorubicin treatment for different time points. β-actin was used as loading control. c MCF7 and MCF7/LMTK3 cells were fixed and subjected to confocal immunofluorescence analysis. Representative confocal microscopy images for γH2AX and LMTK3 are shown for different time points. d MCF7 and MCF7-LMTK3 cells were treated with 1 µM of doxorubicin for up to 2 h. Following, the media was removed allowing cells to grow in fresh complete media for another 10 h. Quantitative analysis of γH2AX foci was performed. All error bars represent the mean ± SEM (50 cells were analysed per each time point; **P ≤ 0.01). e MCF7 and MCF7/LMTK3 cells were fixed and subjected to confocal immunofluorescence analysis. Representative confocal microscopy images for γH2AX are shown for different time points following doxorubicin release. f Doxorubicin-induced DNA damage measured by neutral comet assay. MCF7 and MCF7-LMTK3 cells were treated with 1 µM of doxorubicin for up to 2 h. Following, the media was removed allowing cells to grow in fresh complete media for another 6 and 24 h. Cells were analyzed by fluorescence microscopy; The tail moment was quantified using the ImageJ software with OpenComet plug-in. All error bars represent the mean ± SEM (51 cells were analysed per each time point; ***P ≤ 0.001; ****P ≤ 0.0001). A representative western blot of LMTK3 expression in MCF7 and MCF7/LMTK3 cell lines is shown. g MCF7 and MCF7-LMTK3 cells were treated with 1 µM of doxorubicin for 2, 4, 8, 16, and 24 h. Western blot analysis was performed using the respective antibodies. β-actin was used as loading control. Representative results and quantification of protein bands using ImageJ software are shown for two separate blots. h MCF7 and MCF7-LMTK3 cells were treated with 1 µM of doxorubicin for 15 min, 30 min, 1, 2, and 4 h. Western blot analysis was performed using the respective antibodies. β-actin was used as loading control. Representative results and quantification of protein bands using ImageJ software are shown for two separate blots

