Fig. 3.
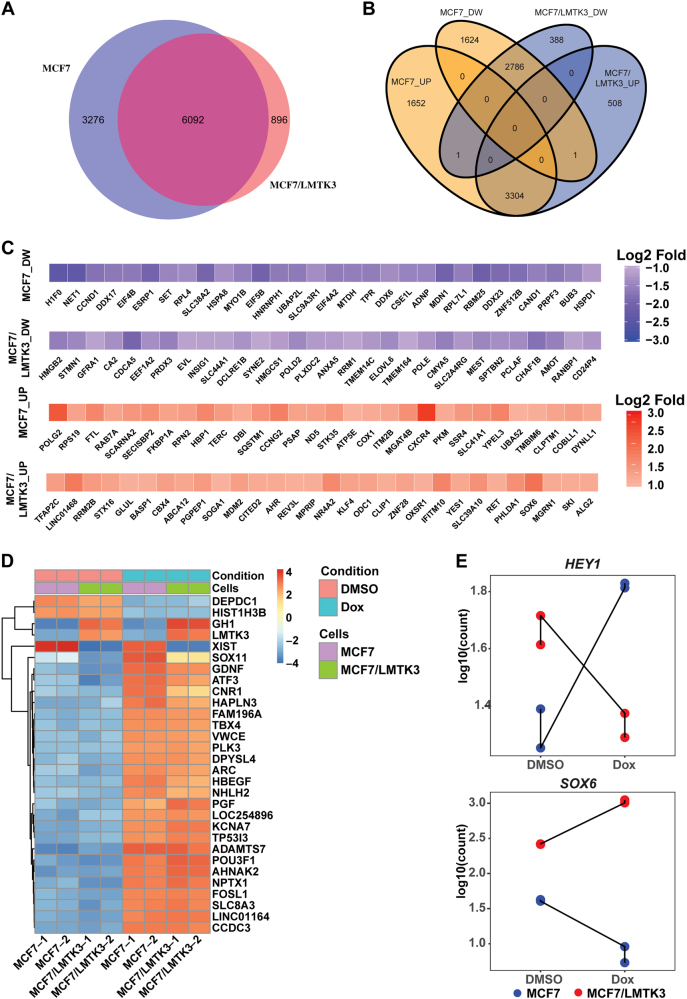
Global transcriptomic alterations induced by doxorubicin in MCF7 and MCF7/LMTK3 cells. a Venn diagram showing a high degree of overlap as well as differences in the transcripts significantly regulated by doxorubicin in MCF7 and MCF7/LMTK3 cells (Padj < 0.05 and Log2 fold difference of ≥|1|). b Venn diagram comparing numbers of transcripts significantly up (UP) or down-regulated (DW) in each dataset. c Heatmaps showing top-30 (ordered based on Padj value) exclusively regulated transcripts upon doxorubicin treatment of MCF7 and MCF7/LMTK3 cells. Downregulated transcripts (DW) are shown in the upper panel, while upregulated transcripts (UP) are shown in the lower panel. d Heatmap showing amounts by which the read counts of the top-30 (ordered based on Padj value) commonly regulated genes deviates from the gene’s average across all the samples. e Count plot comparing the changes in the RNA-seq read counts of HEY1 and SOX6 between MCF7 and MCF7/LMTK3 cells upon treatment with DMSO or 1 μM doxorubicin

