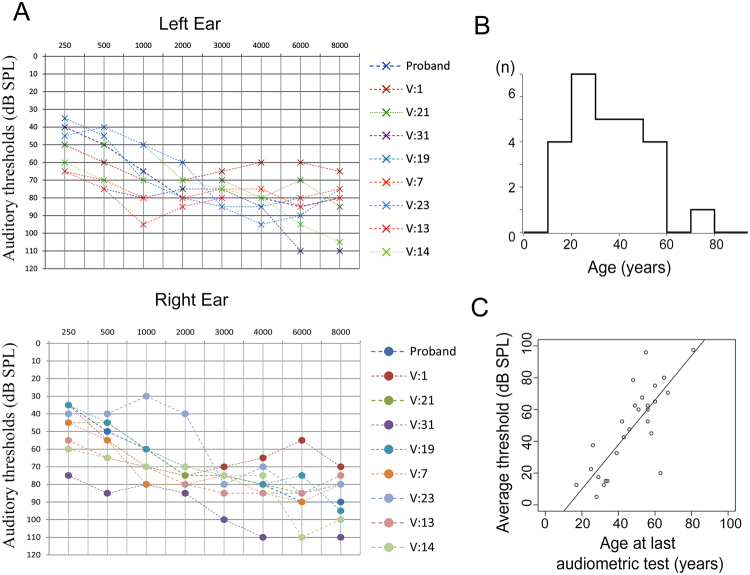
Figure 2.
Tonal Audiometry thresholds of affected family members. (A) Tonal audiometry thresholds of nine affected individuals from family 1. (B) Age distribution of onset of hearing loss in family 1. (C) Distribution of average thresholds from both ears of the affected individuals of family 1 according to their age at examination showing that the fit to a linear regression model is excellent (r2 = 0.6173; t = 6.68; d.f. = 26; p < 10-5).

