Figure 3.
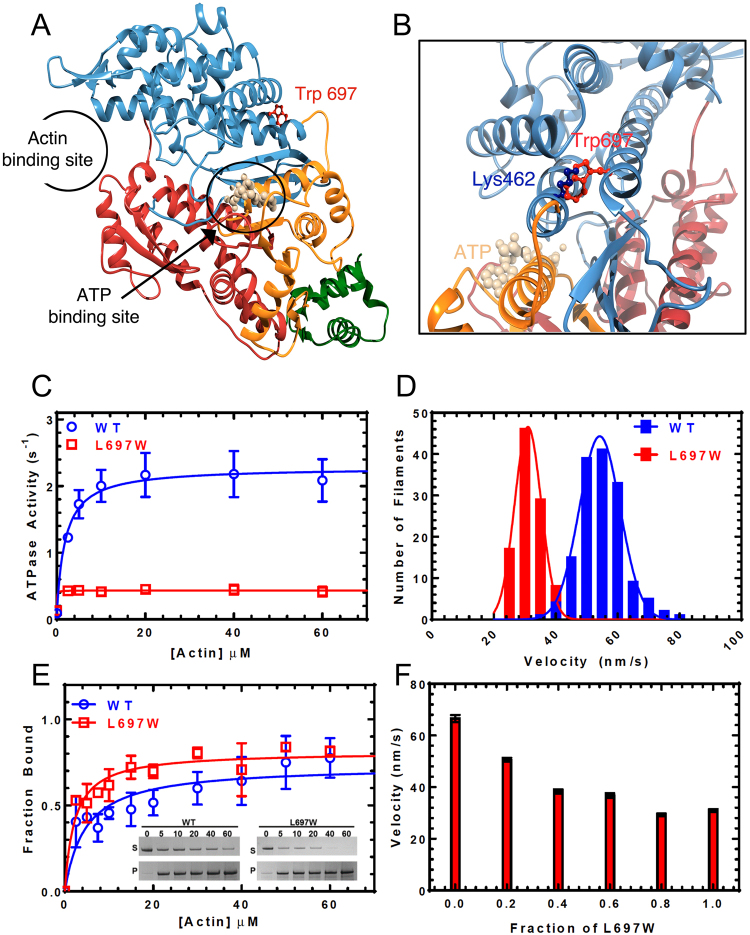
L697W mutation localization and effect on MYO3A motor properties. (A) Homology model of MYO3A motor domain in ribbon representation with the N-terminal domain in orange, U50 in blue, L50 in red and the converter domain in green. The ATP-binding site and actin-binding pocket are indicated. The ATP molecule bound to the nucleotide-binding site is shown in ball and stick representation and colored in tan. Trp697 is labeled, colored in red and its side chain is shown in ball and stick representation. (B) Close up view of Trp697 and Lys462 side chains position and clash. (C) The steady state actin-activated ATPase activity was plotted as a function of actin concentration and the data were fit to a hyperbolic function to determine maximum ATPase activity (kcat) and the actin concentration at which ATPase is one-half maximal (KATPase). (D) The in vitro motility of the WT and L697W MYO3A was compared (n = 150 filaments). The actin sliding velocities for each construct were fit to a Gaussian distribution and the average velocity was determined. (E) Actin co-sedimentation assays were performed to examine the steady state actin affinity (KActin). The fraction bound is plot a function of actin concentration and fit to a hyperbolic function to determine KActin. (Inset shows the coomassie stained SDS-PAGE gels used to resolve the fraction bound at each actin concentration). (F) In vitro motility examined in a mixture of L697W and WT MYO3A. The average velocity of 25 filaments per condition is plotted in each condition (fraction of mutant to total MYO3A present). Table 1 displays the summary of ATPase and in vitro motility values.

