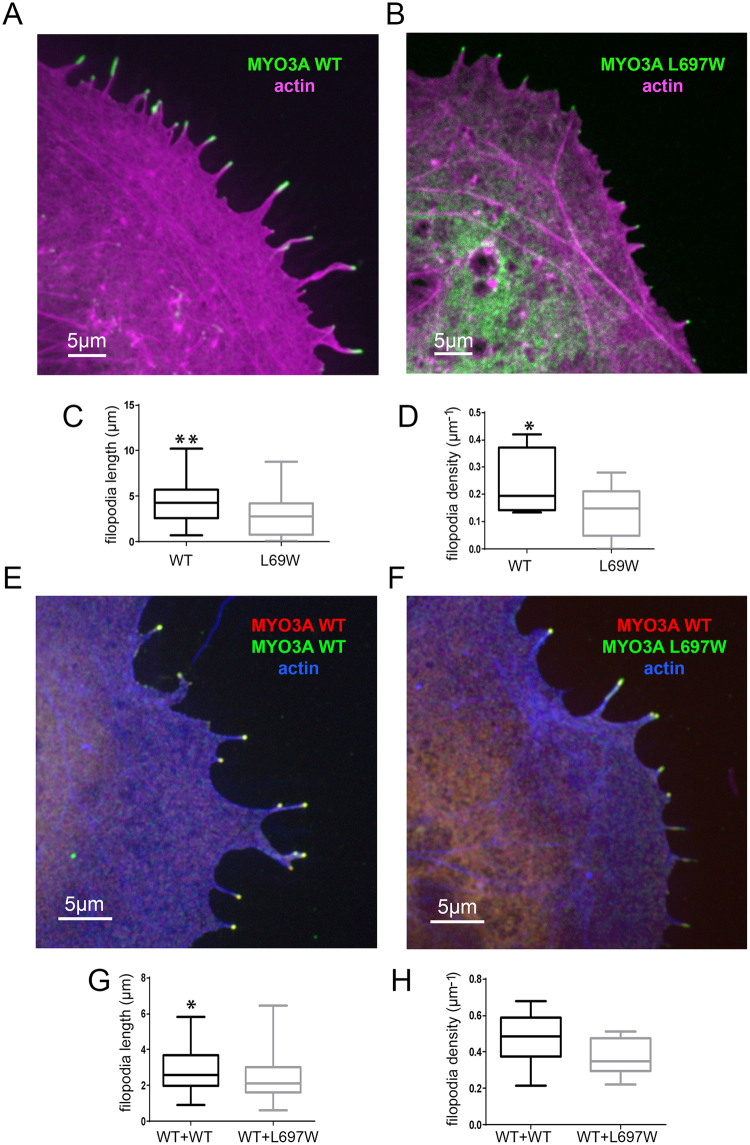
Figure 4.
Impact of L697W mutation on MYO3A function. (A) Confocal images of transfected COS7 cells showing filopodia tip localization of GFP-MYO3A WT (green) or (B) GFP-MYO3A L697W (green). F-actin was stained with phalloidin and it is shown in magenta. (C) Filopodia length in WT and L697W coexpressing cells are presented as box plots, with upper and lower whiskers representing the maximum and minimum value, top, and bottom of the boxes representing the upper and lower 25th percentile and the bars bisecting the boxes representing the median values. P values were calculated using one-way ANOVA analysis are shown as asterisks (**p < 0.01 and *p < 0.05). (D) Filopodia initiation activity for WT and L697W measured as filopodia length and number per 10μm of cell perimeter and represented as in c. (E) GPFP-MYO3A WT and (F) L697W (green) retained tip localization when coexpressed with mCherry-MYO3A WT (red) in COS7 cells. F-actin was stained with phalloidin and it is shown in blue. (G,H) Filopodia length and initiation activity of WT and L697W in presence of mCherry-MYO3A WT (WT + WT and WT + L697W, respectively) represented as in (C,D).

