Figure 6.
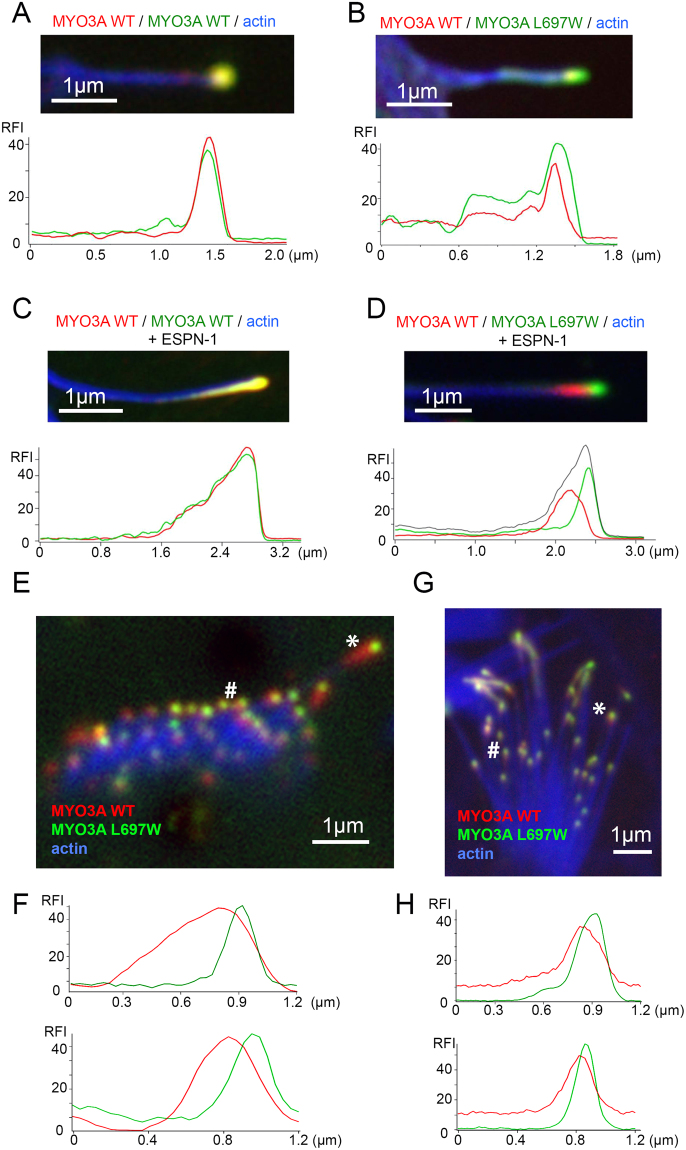
Cargo specific tip localization behavior of MYO3A L697W. (A) Close-up view of representative filopodia and fluorescence profiles along the filopodia length of COS7 cells coexpressing wild-type GFP-MYO3A WT (green) and mCherry-MYO3A WT (red). (B) Expression pattern and fluorescence profiles of mutant GFP-MYO3A L697W (green) and mCherry-MYO3A WT (red) proteins in a representative COS7 cell filopodia (C) Filopodia localization and fluorescence profiles of GFP-MYO3A WT (green), mCherry-MYO3A WT (red) proteins in a COS7 cell coexpressing GFP-MYO3A WT, mCherry-MYO3A WT and untagged ESPN-1. (D) Close-up view of filopodia and fluorescence profiles along it of COS7 cells coexpressing GFP-MYO3A L697W (green), mCherry-MYO3A WT (red), actin (in blue) and untagged ESPN-1. The sum of the green and red channels (black trace in the fluoresce profile) shows the same profile as MYO3A WT in the previous panel. (E–G) Confocal images of transfected mouse auditory (E) and vestibular (G) hair cells coexpressing mCherry-MYO3A WT (red) and GFP-MYO3A L697W (green) proteins. (F–H) Fluorescence profiles along the stereocilia length of auditory (F) and vestibular (H) hair cells coexpressing mCherry-MYO3AWT (red) and GFP-MYO3A L697W (green). For all the images, actin was stained with AlexaFluor®-405 phalloidin and it is shown in blue.

