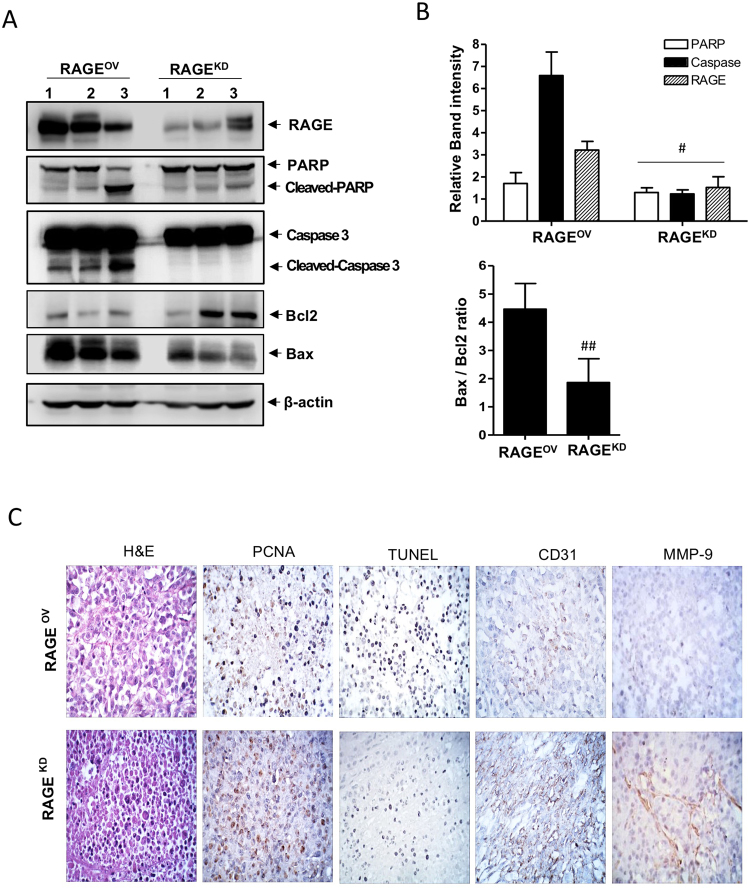
Figure 6.
Hyperacetylation induces apoptosis in RAGEOV but not in RAGEKD xenografts. Immunological analysis of the tumor tissues from RAGEOV and RAGEKD xenografts treated with 20 mg/(kg·day) ASA plus subcutaneous injection of 0.5 mg/kg TSA three times weekly. Numbers on the top of the band present individual tumor which were derived from different xenografts. (A and B) Representative immunoblots for RAGE, Bax, Bcl-2, caspase-3, and PARP-1. β-actin was used as a protein-loading control. Immunoblotting for each protein was performed at least twice using independently prepared lysates with similar results. Full-length blots are presented in Supplementary Fig. S4. Fold changes in apoptosis marker levels relative to the control are shown for each treatment. Columns represent the mean (n = 3); bars represent the SE. #P < 0.05, ##P < 0.01 versus RAGEOV cells was determined by one-way ANOVA followed by Bonferroni’s test. Data are representative of replicate experiments with similar results. (C) Representative staining images for histology (H&E staining), proliferation index (PCNA staining), neovascularization (CD31 staining), metastatic index (MMP-9 staining), and apoptotic bodies (TUNEL staining) from tumor sections from three mice of each group.

