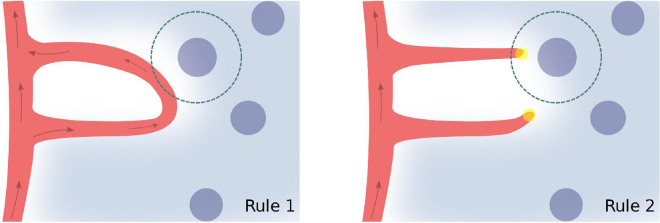
Figure 2.
Schematic representation of the two different rules for hypoxia regulation. In the simulation with Rule 1 a cell in hypoxia will deactivate its production of VEGF when the blood circulation reaches a site at a distance from the cell shorter than the oxygen diffusion length. In the model with Rule 2, the VEGF production will cease if any vessel reaches a point closer to the cell than the oxygen diffusion length, independently of whether there is blood circulating in that vessel or not. The endothelial cells are represented in red, the tip cells are the yellow circles and the angiogenic factor is represented in light blue. The cells in hypoxia are represented as darker blue circles. The arrows indicate the vessels with blood flow.

