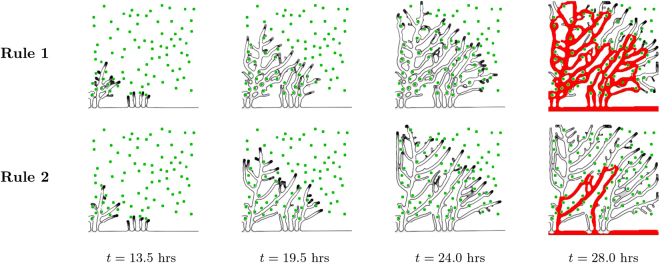
Figure 3.
Vessel growth in two dimensions. Evolution of a vascular system with an initial capillary at the bottom and a random distribution of hypoxic cells (green circles), which drive the chemotactic response by ECs. Four time points are represented. The first row of figures correspond to the vessel network grown under the Rule 1 for hypoxic cell deactivation, while the second row of images correspond to the vessel network grown under Rule 2. On the final column the irrigated vessels are identified in red. The number of anastomoses and the number of vessels with circulating blood are much higher when Rule 1 is implemented.

