Figure 1.
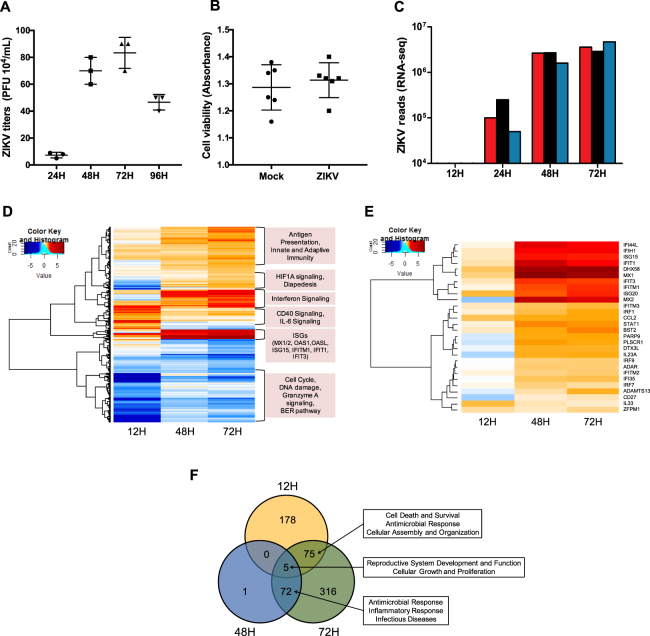
RNA-seq analysis reveals differentially expressed genes in ZIKV-infected hSeC. (A) ZIKV titers in supernatant measured using plaque assay (n = 3 per time point). (B) ZIKV did not induce cytopathic effect in hSeC at 72 hpi as compared to mock. Cytopathic effect assessed using the CellTiter 96 AQueous One Solution cell proliferation assay kit, and percent cell viability was calculated by comparison to mock-infected cells. (C) ZIKV genome reads from RNA-seq analysis (n = 3 per time point). (D,E) Differentially expressed genes (DEGs) across all time points (log2 FC >|1.5|, p < 0.05) determined using voom and limma packages in Bioconductor. (D) Global heat map of DEGs shows downregulation of cell cycle, DNA damage, granzyme A signaling, and BER pathways at 12 hpi, and upregulation of interferon signaling, including ISGs at 48 and 72 hpi. (E) Heat map of interferon signaling. Heat maps were generated using gplots and WGCNA Bioconductor packages. (F) Venn diagram of DEGs for each time point by significance alone (p < 0.05) identifying top modulated functional networks between time points (determined by IPA).

