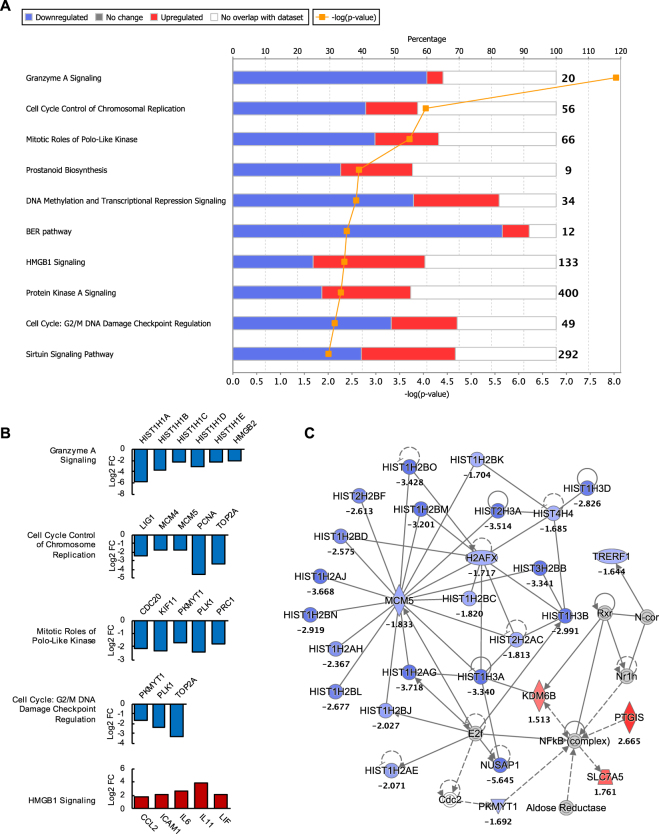
Figure 2.
Biological pathways and functional networks modulated by ZIKV in hSeC at 12 hpi. (A) Top IPA Canonical Pathways across entire dataset at 12 hpi. Pathways order by most significant (Fisher’s exact test right-tailed). Cellular growth and proliferation (cell cycle, DNA replication and repair) pathways were predominantly downregulated at 12 hpi. Stacked bars represent percentage of genes modulated and/or IPA predicted out of total (in bold, right) in pathway. (B) Significant DEGs (p < 0.05; determined by limma package in Bioconductor) of select cellular growth and proliferation pathways and HMGB1 Signaling pathway at 12 hpi meeting log2 FC cutoff of >|1.5|. (C) Top scoring IPA functional network at 12 hpi: Cellular Assembly and Organization, DNA Replication, Recombination, and Repair, Post-Translational Modification network. Solid line between nodes represents direct interaction and dashed line represents indirect interaction. Nodes ranked by log2 FC. Node shapes represent functional classes of gene products. Vertical diamond shaped nodes represent enzymes; horizontal diamond peptidases; trapezoid transporters; triangle kinases; horizontal oval transcription regulators; vertical oval transmembrane receptors; rectangle growth factors; circle proteins. Node color indicates level of expression. Red is upregulated, and blue is downregulated. IPA functional network cutoff criteria for DEGs was log2 FC >|1.5| (p < 0.05).

