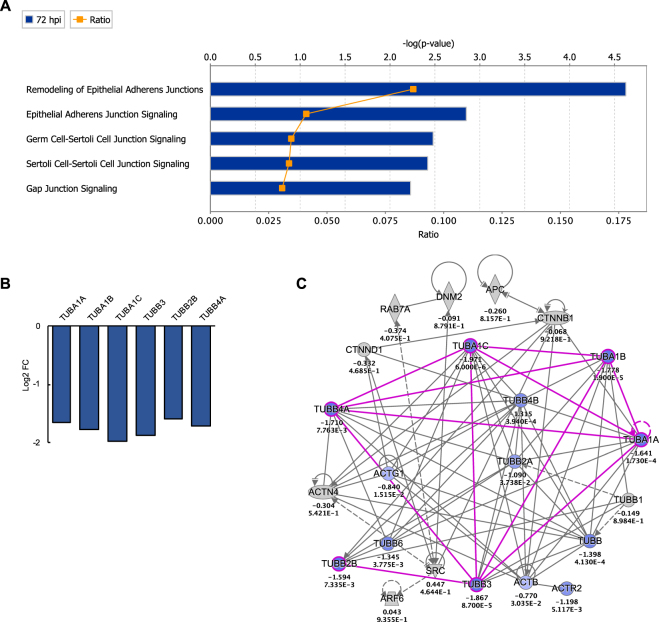
Figure 5.
Effect of ZIKV on Cell-cell junction pathways (A) IPA cell-cell junction pathways modulated at 72 hpi. Ratio (orange points) represents the number of genes in a given pathway that meet the cutoff criteria (log2 FC >|1.5| and p-value of <0.05, determined by limma in Bioconductor), divided by the total number of genes that make up the pathway in the reference gene set. Blue bar represents –log(p-value). (B) Significant DEGs that meet the cutoff criteria among all junction pathways were those encoding for tubulin-αβ proteins. (C) Custom network of Remodeling of Epithelial Adherens Junctions pathway, which had the highest expression ratio among junction pathways, with 6 significant DEGs out 69 total genes in the pathway (Ratio of 0.087). Genes displayed in the network represent pathway gene coverage within the dataset. Genes such as ENDO6, TUBB, TUBB2A, TUBB4B, TUBB6, ACTB, ACTR2, and ACTG1 were significantly downregulated in the dataset (p < 0.05) but did not meet the log2 FC cutoff of >|1.5|.

