Fig. 1.
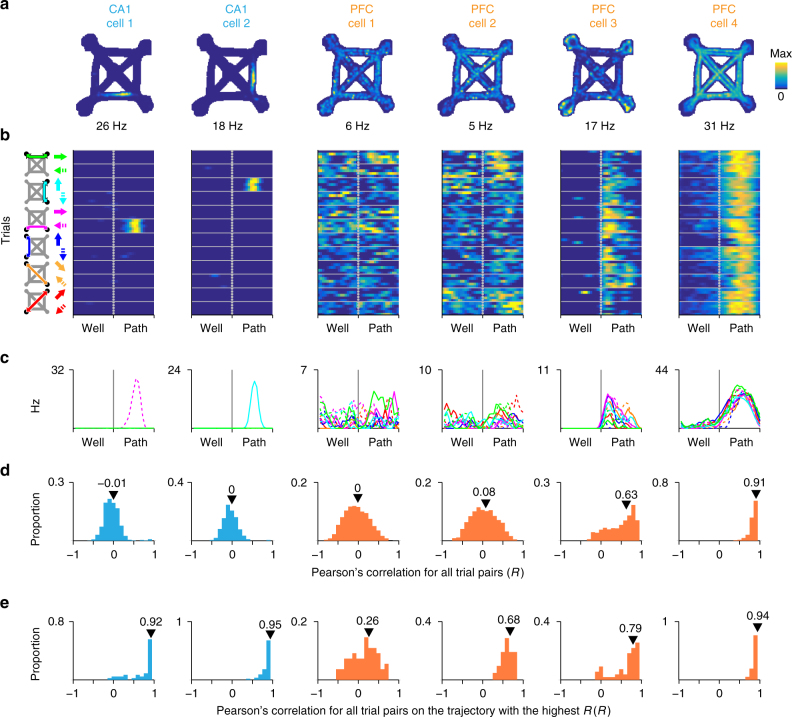
Example CA1 and PFC task activity patterns. a Occupancy normalized spatial firing maps for 2 CA1 and 4 PFC cells that were simultaneously recorded. The maximum firing rate for each cell is indicated below each panel. b Time normalized trial firing rate maps for the cells in a. The vertical dotted line separates well and path trial phases. Horizontal solid lines separate trials on each trajectory. Five example trials are shown for each trajectory. The trajectory for each group of trials is indicated by the schematic to the left of column 1. Solid and dotted arrows indicate the two directions of travel on a path. The firing rate color scale is the same as in a–c. Median firing rate for each trajectory. Line color corresponds to arrow color scheme in b–d. Distribution of pairwise Pearson’s correlation for trial firing profile across all trials. All-trial similarity (Rmedian) is the median of the distribution and is indicated by the arrowhead. e Distribution of pairwise Pearson’s correlation for firing profile of trials on the trajectory with the highest median pairwise correlation. Maximum within-trajectory similarity (Rmax) is the median of the distribution and is indicated by the arrowhead

