Fig. 3.
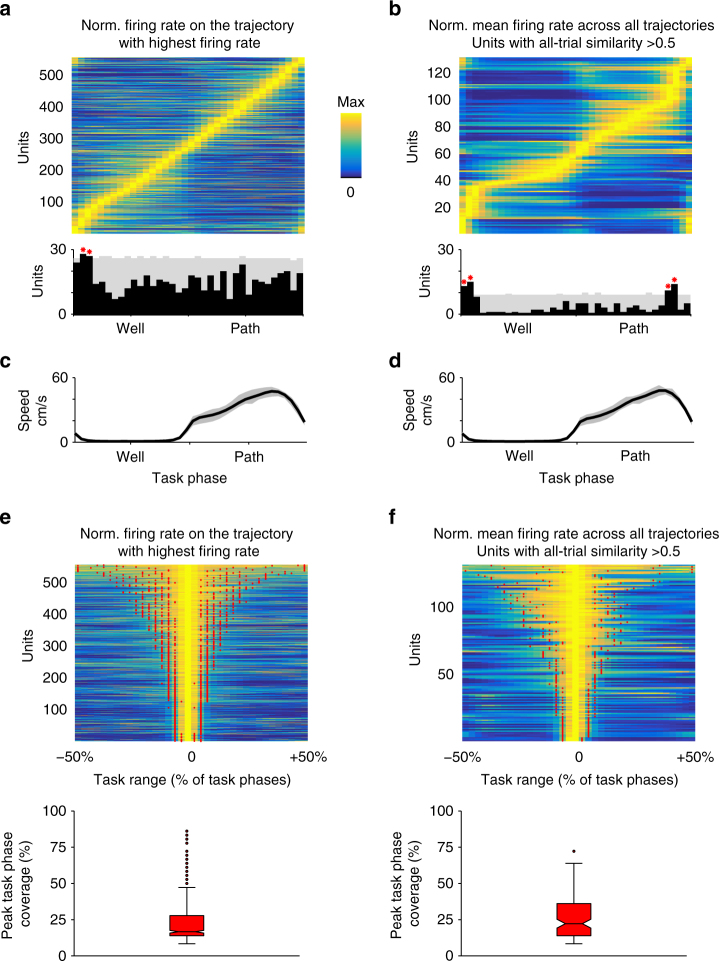
PFC activity is distributed across and shows specificity for task phases. a Upper panel shows normalized mean firing rate for each cell on the trajectory with the highest mean firing rate. Cells (N = 556) are sorted by the task phase with the maximum firing rate. PFC firing spans the entire trial phase range. Lower panel shows the distribution of peak firing task phase (black bars) and the 99% confidence interval of expected distribution from 5000 permutations (gray). Red asterisks mark task phases (near well entry) with a greater than expected numbers of cells. b Upper panel shows normalized mean firing rate for each cell across all trajectories. Only cells with similar firing across different trajectories (Rmedian > 0.5) are shown. Cells (N = 131) are sorted by the task phase with the maximum firing rate. Lower panel shows the distribution of peak firing task phase (black bars) and the 99% confidence interval of expected distribution from 5000 permutations (gray). Red asterisks mark task phases (near well entry) with a greater than expected numbers of cells. c, d Corresponding median speed profile for a and b respectively. The interquartile range is in gray. e Normalized mean firing rate for each cell on the trajectory with the highest mean firing rate (same as a) aligned to the trial phase where each cell’s rate was maximum and sorted by peak task phase coverage (bounds marked by red dots). Bottom panel shows the corresponding box plot of peak task phase coverage. Most PFC cells are active over less than half of task phases. f Normalized mean firing rate for each cell across all trajectories aligned to the trial phase with maximum firing rate (same as b) and sorted by peak task phase coverage. Only cells with similar firing across different trajectories (Rmedian > 0.5) are shown. Peak task phase coverage bounds indicated by red dots. Bottom panel shows the corresponding box plot of peak task phase coverage. Peak task phase coverage is the number of contiguous task phases around the peak with firing rate exceeding 66.67% of maximum

