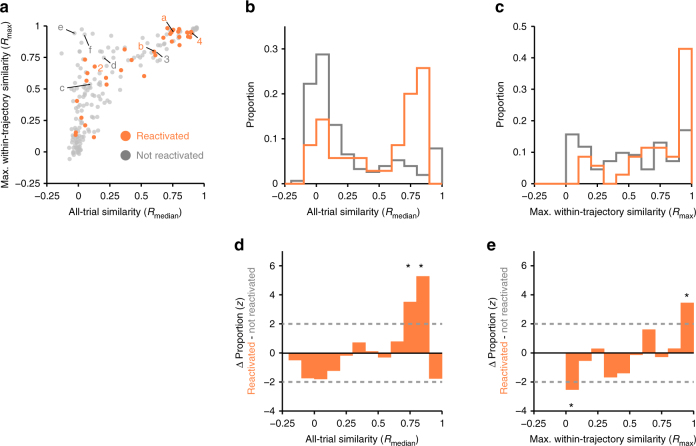
Fig. 5.
SWR reactivated path-preferring PFC cells show higher activity similarity across different trajectories. a Scatter of Rmax and Rmedian for SWR reactivated (orange, N = 35) and non-reactivated (N = 161, gray) PFC cells. Cells from Figs. 1 (cells 2 and 4) and Fig. 4a (cells a-f) are labeled. b Distribution of Rmedian (from a). Kolmogorov–Smirnov test: ***p < 10−3. c Distribution of Rmax (from a). Kolmogorov–Smirnov test: ***p < 10−3. d Difference in the Rmedian distributions between path SWR reactivated and not reactivated PFC cells normalized using a permutation test (see Methods section). e Difference in the Rmax distributions between path SWR reactivated and not reactivated PFC cells normalized using a permutation test (see Methods section). Dotted lines indicate ±2 S.D.

