Fig. 6.
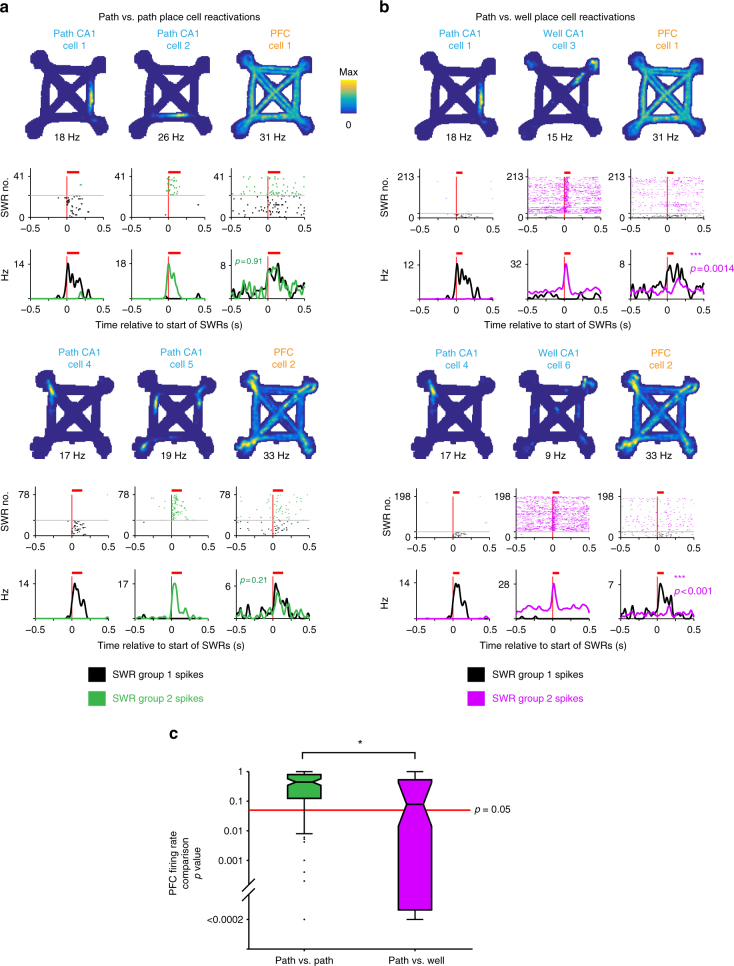
Similar PFC modulation accompanies distinct hippocampal path location reactivations. a–b Spatial firing rate map, SWR aligned spiking raster and firing rate for a pair of CA1 cells and a PFC cell that were recorded simultaneously. Each group of SWRs was defined as events containing only spikes from one of the two CA1 cells (columns 1 and 2). The corresponding spiking and firing rate of the PFC cell during these two groups of SWRs are shown in column 3. The mean duration of SWRs is indicated with a red bar. The difference in PFC firing rates between the two groups of SWRs is quantified using a permutation test. Two such sets are shown (CA1 cells 1–3 and PFC cell 1, and CA1 cells 4–6 and PFC cell 2). In the top set, CA1 cells 1 and 2, and PFC cell 1 corresponds to the CA1 cells and the PFC cell 4 in Fig. 1 respectively. PFC cell 2 in the bottom set corresponds to PFC cell a in Fig. 2. a Comparison of PFC spiking between SWRs containing different path place cell reactivations. b Comparison of PFC spiking between SWRs containing path or well place cell reactivations. c Boxplot of permutation test p values for comparisons of PFC firing rates during SWRs between groups of SWRs. PFC cells with similar firing patterns across trajectories (Rmedian > 0.5) were included. PFC activity during SWRs reactivating different CA1 path location representations was similar (green, higher p values, N = 127 SWR group pairs, examples in a) compared with activity during SWRs reactivating CA1 path or well location representations was dissimilar (magenta, lower p values, N = 87 pairs, examples in b). Wilcoxon rank-sum test: ***p < 10−3

