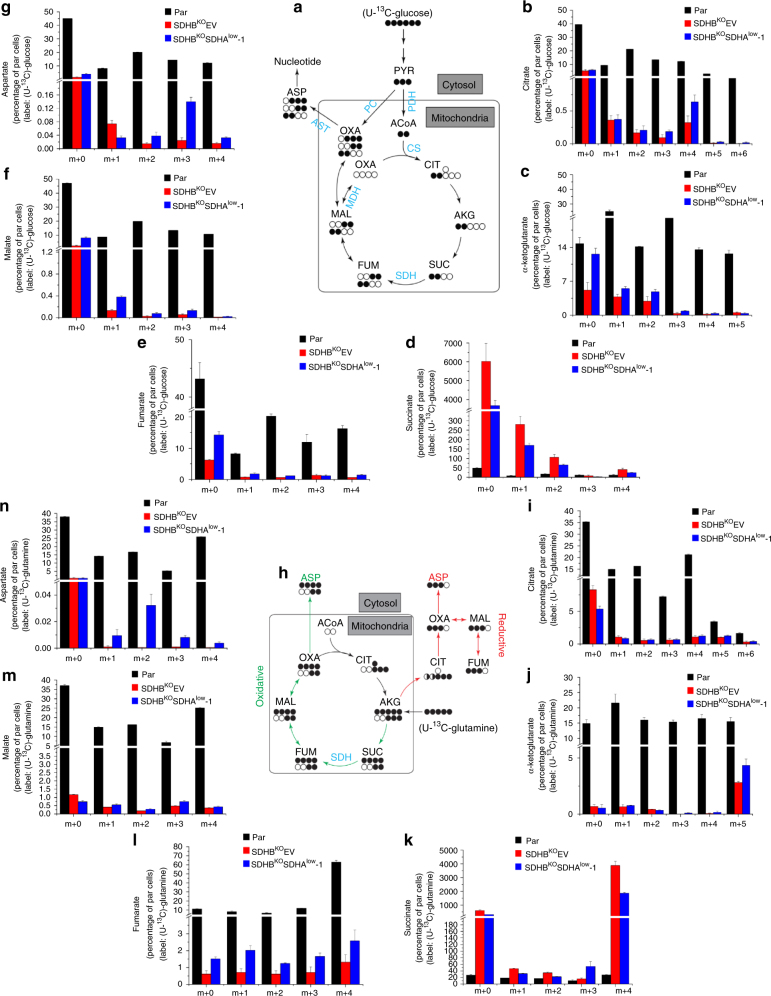
Fig. 7.
CIIlow restricts TCA-linked anabolism. a and h, Predicted labeling patterns of indicated metabolites from U-13C6-glucose (a) and from U-13C-glutamine (h) (filled circles 13C; open circles 12C). The oxidative (green) and reductive (red) carboxylation pathways are indicated (h). Isotopologue distribution of intracellular citrate (b, i), a-ketoglutarate (c, j), succinate (d, k), fumarate (e, l), malate (f, m), and aspartate (g, n) after incubation for 24 h with 5 mM unlabeled glucose and 20 mM U-13C-glucose or 4 mM U-13C-glutamine, respectively. The data were obtained using LC-MS/MS analysis. The Y values are presented as the percent values of the sum of all the isotopologues per each metabolite in parental cells; ‘m + …’ indicates the relevant isotopomer. Data are presented as mean ± SD, n = 3. PYR pyruvate, ACoA acetyl-CoA, CIT citrate, AKG α-ketoglutarate, SUC succinate, FUM fumarate, MAL malate, OXA oxaloacetate, ASP aspartate, PDH pyruvate dehydrogenase, PCX pyruvate carboxylase, CS citrate synthase, SDH succinate dehydrogenase, MDH malate dehydrogenase, AST aspartate transaminase

