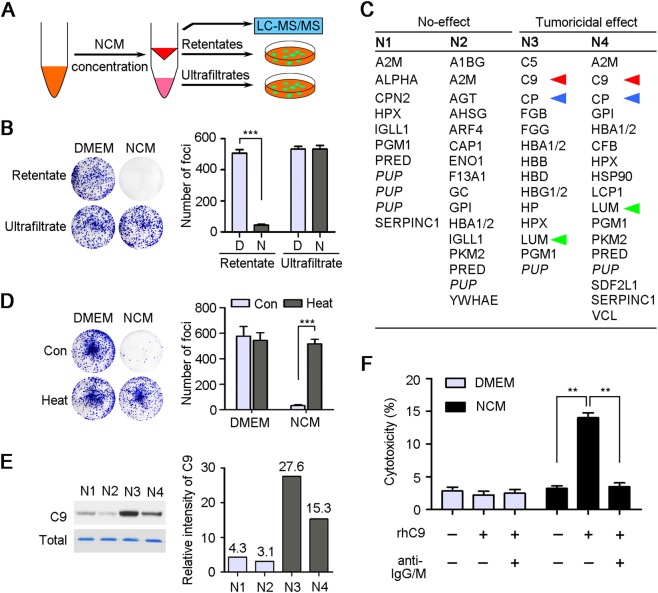
Fig. 2. C9 leads to cancer cell lysis in vitro.
a Diagram of LC-MS/MS analysis of NCM for finding the factors with tumoricidal activity. b Representative results of foci formation assay of LSC1 cells under the retentates or ultrafiltrates (Case 10) treatments. D, DMEM; N, NCM. c Four NCM samples with (N3, N4, Case 4, and 10) or without (N1, N2, Case 2, and 3) tumoricidal activity were analyzed by LC-MS/MS, and the identified proteins with significant difference between two groups were listed (Supplementary data sheet). Three proteins specifically contained in N3 and N4 group were indicated by red, blue, or green triangles, respectively. PUP putative uncharacterized protein. d Representative results of foci formation assays of LSC1 cells under the pre- and post-teat treatments (56 °C water bath for 30 min). e The protein levels of C9 in four NCM samples were confirmed by western blot. Total proteins were stained with Coomassie Brilliant Blue as a loading control, and relative expressions of C9 were also quantified. The quantitative values were showed above the bars. f Tests of LDH released from LSC1 cells under the DMEM and NCM treatments (Case 10) supplemented with rhC9 (20 μg/ml) and blocking anti-IgG/M (1 μg/ml per antibody), respectively. In all panels, error bars represent SEM. **P < 0.01

