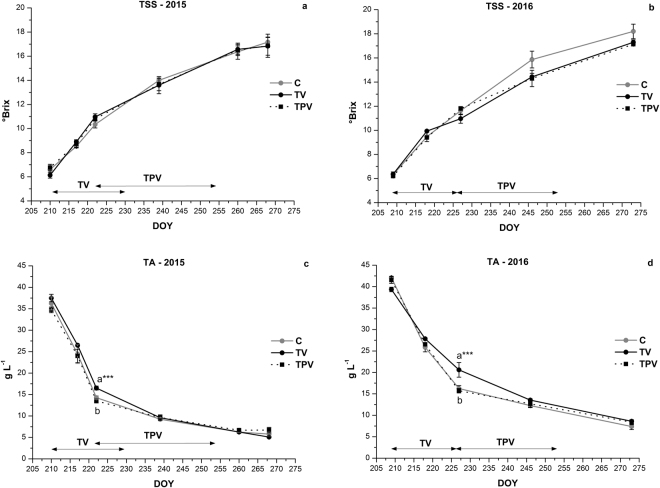
Figure 3.
Evolution of total soluble solid content (TSS; a,b) and titratable acidity (TA; c,d) for Corvina vines treated at low temperature in the night and for the control during the ripening, in 2015 and 2016. Error bars indicate the mean SE (n = 3). Means followed by different letters differ significantly, as calculated by Tukey statistical analysis (*, **, ***p ≤ 0.05, 0.01, 0.001, respectively). The duration of the low night temperature periods is indicated by black double arrows, for TV and TPV treatments.

