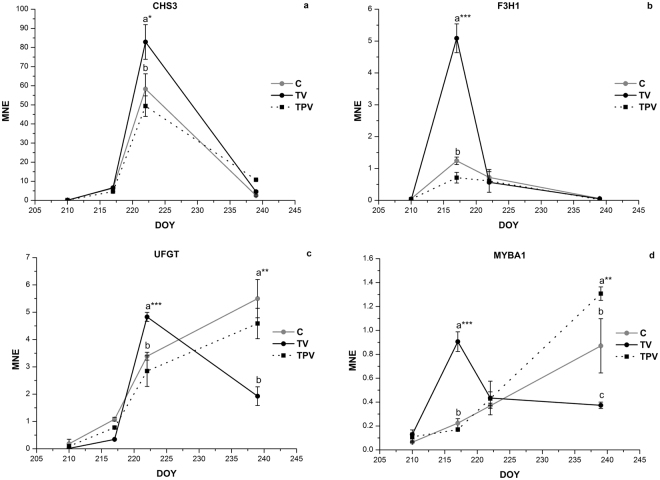
Figure 5.
Expression profiles of CHS3 (a), F3H1 (b), UFGT (c) and MYBA1 (d) genes in the skin of Corvina grapes treated under low night temperature (TV, TPV) and in the control (C), during the experimental period in 2015. Real time RT-PCR data are reported as mean normalized expression (MNE) values, obtained using Ubiquitin-1 as reference gene. Error bars indicate the mean SE (n = 3). Means followed by different letters differ significantly, as calculated by Tukey test (*, **, ***p ≤ 0.05, 0.01, 0.001 respectively).

