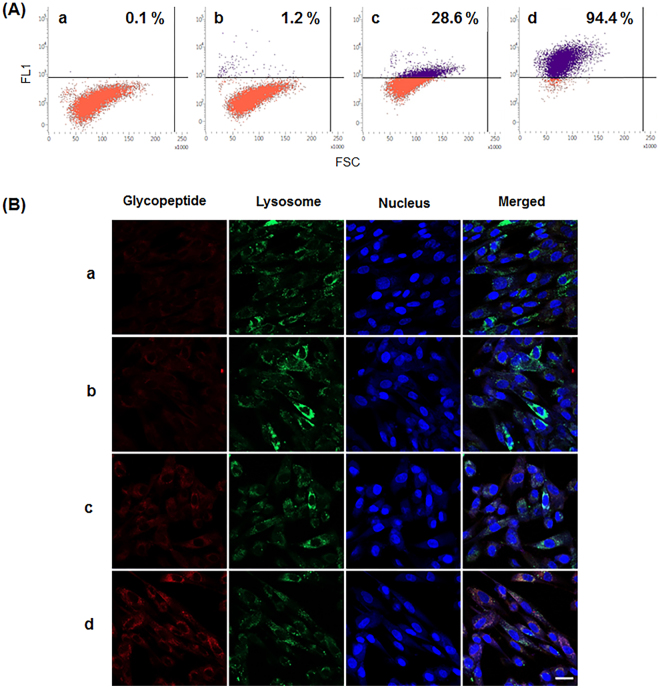
Figure 2.
Analysis of cellular uptake and lysosome targeting capability. The glycopeptides in a – d preparation steps (Fig. 1) were labeled with biotin and then allowed to bind streptavidin-Alexa633. The resulting complexes were incubated with human fibroblasts, followed by analyses using flow cytometry (A) and fluorescence microscopy (B). In flow cytometry analysis, the population of cells displaying higher fluorescence over the threshold level is represented. In fluorescence microscopic images, the glycopeptides, lysosome, and nucleus are represented with red, green, and blue fluorescence, respectively. Scale bar = 100 µm.

