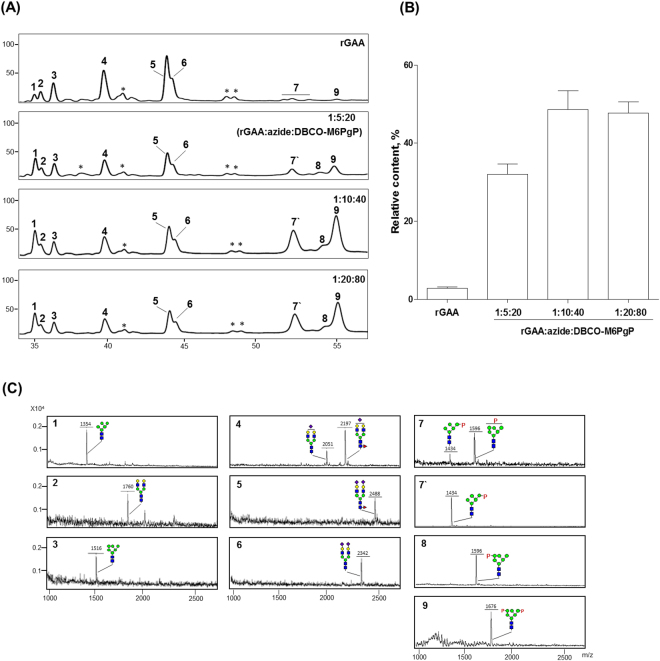
Figure 4.
Analysis of N-glycans obtained from M6PgP-conjugated rGAA. N-Glycans of rGAA and rGAA-azDB-M6PgP (1:5:20, 1:10:40, and 1:20:80 molar ratio reactions) were analyzed by using HPLC (A). The masses of collected peaks were determined by using MALDI-TOF mass spectrometry (C). The identified glycan peaks were designated by numbers whereas unidentified peaks were represented by*. (B) Relative contents (%) of M6P glycan peaks (7–9) were obtained by the calculation of the integrated peak areas [100× (the area of M6P glycan peaks)/(total areas of all glycan peaks)]. The quantified data represent the averages of three repeated experiments with standard deviations. Symbols are identical to those used in Fig. 1.

