Figure 3.

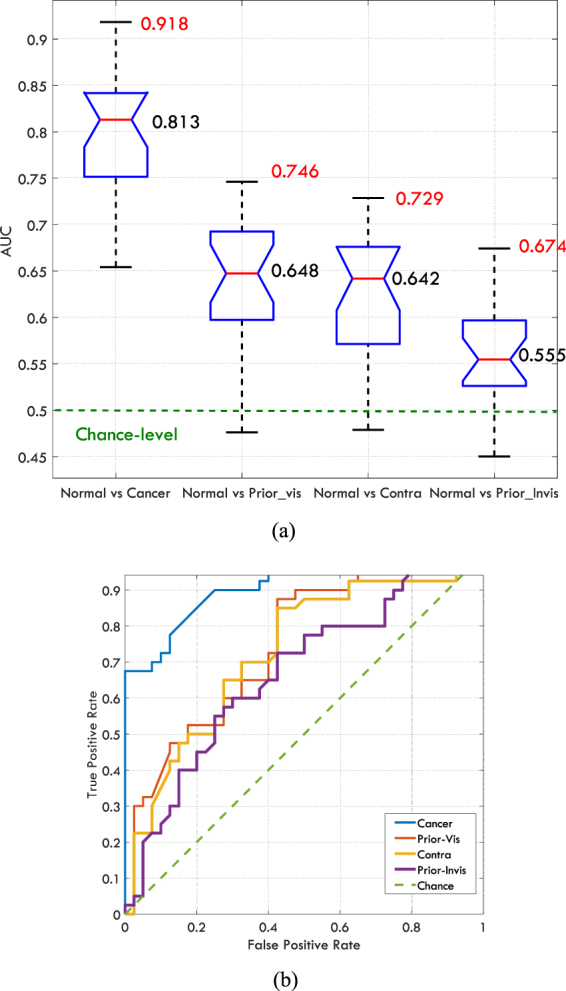
(a) The distribution of AUC values for each pairwise classification, the mean values, and the maximum AUC values are written in black and red respectively. (b) The ROC curves for the best reader across each pairwise comparison.

(a) The distribution of AUC values for each pairwise classification, the mean values, and the maximum AUC values are written in black and red respectively. (b) The ROC curves for the best reader across each pairwise comparison.