
Figure 4.
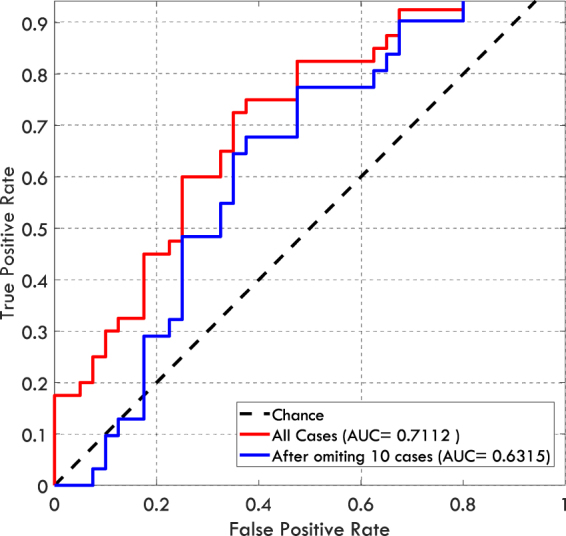
The ROC curves corresponding to the mean gist response calculated based on abnormality scores given by radiologists number 14 and 4 (the best and the second best readers). The red curve shows the classification performance when all cases in the Prior_Invis category were included and the blue curve shows the classification performance when ten cases in the Prior_Invis category with the highest abnormality scores were omitted. At this point the difference between the Prior_Invis and Normal categories is marginally significant.