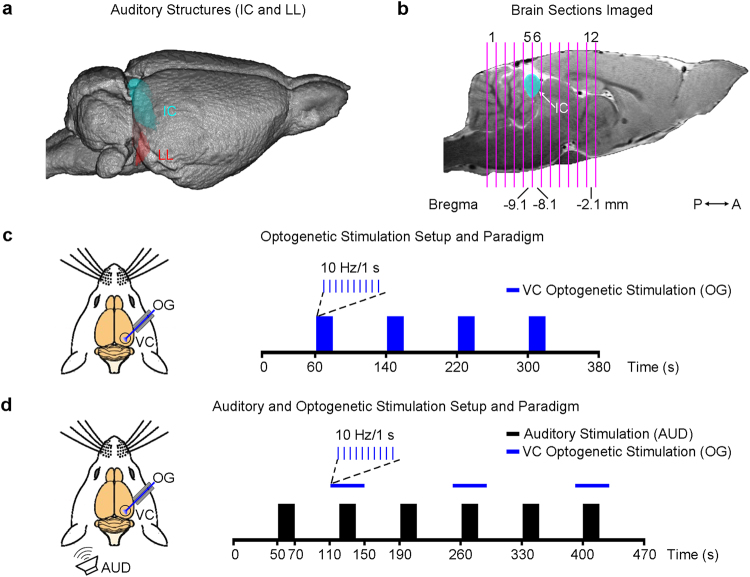
Figure 2.
fMRI data acquisition and optogenetic/auditory stimulation paradigms. (a) Illustration of the inferior colliculus (IC) on a 3D MRI rendered brain. The lateral lemniscus (LL), a subcollicular auditory nucleus7, is also shown. (b) The location of 12 coronal brain sections (the 5th and 6th covering the center of the IC) imaged in this study. (c) Optogenetic stimulation (OG): illustration of the setup (left) and the block-design paradigm used to present the stimulation (right). Blue light pulses (light wavelength: 473 nm, pulse rate: 10 Hz, pulse duty cycle: 10%, light intensity: 40 mW/mm2) were presented to the right visual cortex (VC) in blocks of 20 s light-on and 60 s light-off. The paradigm was repeated twice in each animal. (d) Combined auditory (AUD) and optogenetic (OG) stimulation: illustration of the setup (left) and the block-design paradigm used to present the bi-modal stimulation (right). A broadband noise (bandwidth: 1–40 kHz; sound pressure level: 90 dB) was presented to the left ear of animals in blocks of 20 s sound-on and 50 s sound-off, while blue light pulses were presented to the right VC from 10 s before to 10 s after, during every even sound-on period. This paradigm was repeated 4 times in each animal.

